Analysis & Model updates + Educational: Portfolio Immunisation
Analysis & Model updates + Educational: Portfolio Immunisation
Masterpiece on Fixed-Income strategy + 4Q23 Earnings + The Week in the Markets

Hi there,
The first of the two consecutive busiest weeks of the quarter in the markets, and that is evident with one of the most informative dispatches in recent weeks!
The Week in the Markets: Oil tanker impacted by missile in the Red Sea, Pause to new US LNG export terminal licences, 4Q23 earnings season, liquidity…
Educational: A fixed-income strategy to learn how to deal with interest rates as institutional investors do (including multiple applicable examples). A masterpiece
Analysis & Model updates on: Marine Products, MarineMax and SL Green
Portfolio Management: Detail of our Long /Short Portfolio (monitor tool with 3 stages). Pretty active week with some reductions, an exit and an increase.
The Week in the Markets
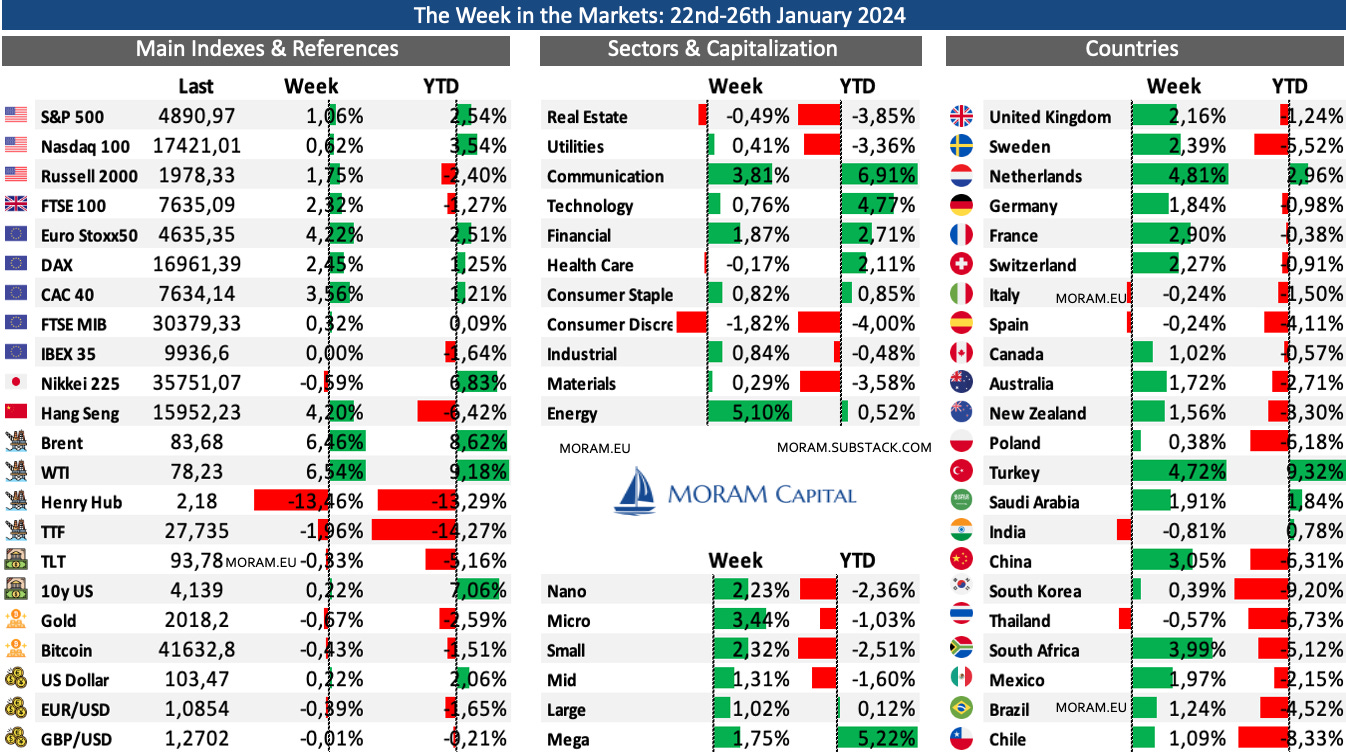
Another new week of advances and historic highs for most indices. The S&P has extended its streak, with 12 out of the last 13 weeks seeing gains. The novelty is that, unlike previous weeks, the increases have not been concentrated solely in Megacaps (dragging the indices) but across the entire market. It is evident that January (so far) it has been very good for large companies and indices and quite normal & volatile for the rest. Oil and shipping have benefited from the escalation of the conflict in the Red Sea, TLT and Nikkei have stood out and there has been a lot of volatility for BTC pre and post-approval of the ETF. On the negative side, it has been challenging for Natural Gas, China, and Emerging Markets overall.
But returning to this week, we focus on:
Macro data, liquidity, and central banks
Latest development in the Red Sea
US decision to pause the issuance of new licenses for LNG exports
Earnings season (Leading companies such as Tesla, ASML, Netflix, American Airlines, Valero... and our small caps)
The macroeconomic data (all data at the end of this section) has been very good, and there have been no significant developments in the forecasts of interest rate cuts, neither from the Fed (where the market gives approximately a 50% chance of a cut in March), nor from the ECB, where it seems the first cut will be in June.

China has unveiled further stimulus initiatives: Beginning February 5th, the People’s Bank of China will reduce the required cash reserves for banks. Additionally, PBOC Governor Pan revealed plans to decrease interest rates by 25 basis points for refinancing and rediscounting loans, aiming to bolster agriculture and small enterprises starting January 25th. Analysts anticipate ongoing pro-growth strategies from the central bank to restore consumer confidence, which has suffered amid China's prolonged property market slump and deflationary trends.
The FED cut short the arbitrage through which banks were benefiting by financing themselves through the BTFP and earning interest on reserve balances. Furthermore, it confirms the end of this emergency bank financing facility in March.
The conflict in the Red Sea continues to escalate, affecting maritime transportation and increasing geopolitical tensions. This Friday, late market hours, the Houthis hit an oil tanker (The Marlin Luanda), further exacerbating the situation on the area (there are no victims). The vessel was managed by Trafigura, the world's largest private metals trader and second-largest oil trader, which has confirmed that after Friday's incidents, it will divert all its ships from transiting the Red Sea (impacting the price of several commodities as it will take more days to re-route boats by SouthAfrica & also the availability of vessels as this re-route increase trip length)
One of the news of the week in the commodity sector has been the pause in granting new licenses for US LNG export plants. It is important to emphasize that this LNG moratorium will not slow down the expansion of US exports in the near-term (as it does not affect at terminals under construction); US LNG export capacity is expected to almost double over the next several years.
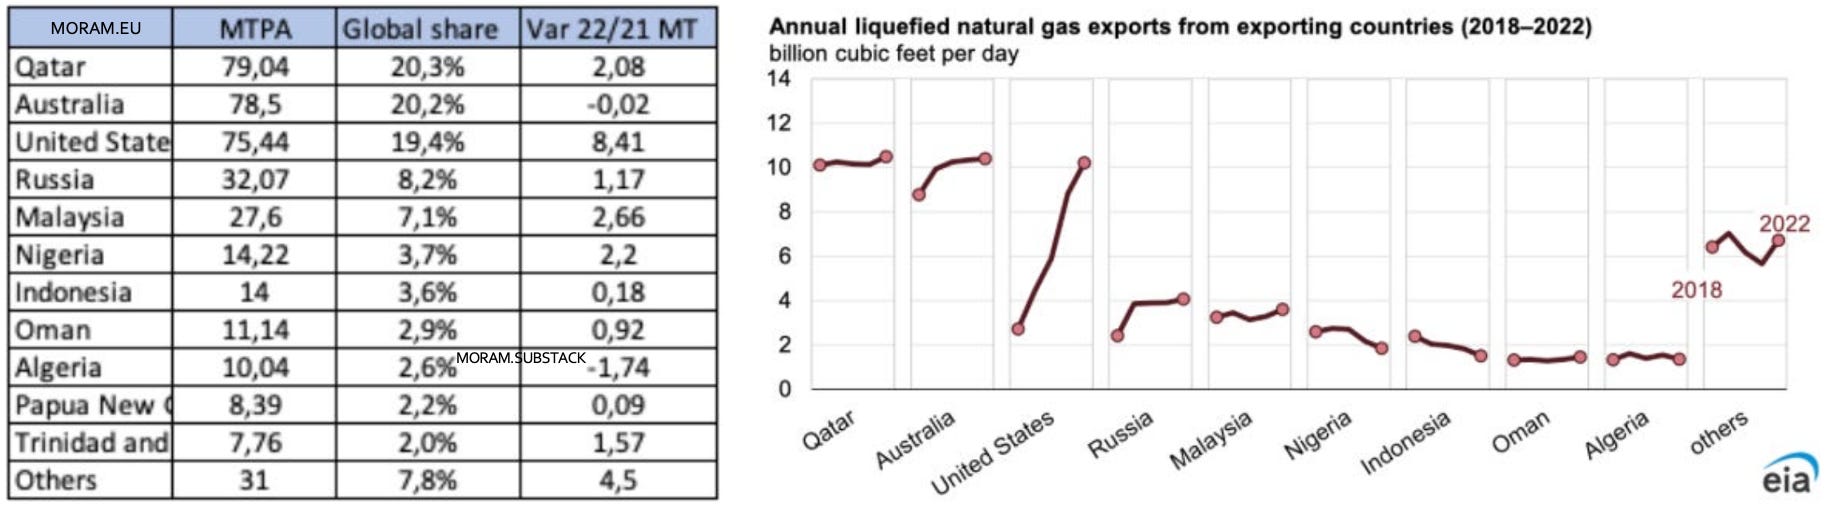
The moratorium on US LNG projects won’t impact global gas supply over the next 4-5 years. However, it may force buyers in Asia/Europe to think twice before signing a deal with projects that don't have approvals. Those buyers may go elsewhere (Qatar, FLNG projects.. which would be another tremendous opportunity for Golar). Energy Transfer, Commonwealth, and Venture Global LNG (CP2) are among the most impacted companies because of the decision.
In summary, not immediate but bad news for Europe, which after cutting ties with Russia (and mysteriously suffering a sabotage of Nordstream 2), now sees its main ally selling to them under the guise of climate change, driven by electoral motives.
If you are interested on the LNG industry, have a look at our recently published Guide to the LNG industry where we explain in detail how it works, the different segments, the main players and where we see the opportunities
4Q23 Earnings
This week has been primarily characterized by earnings season (as we mentioned last week, it was the first of the two big weeks of this season).
We comment briefly on segment market leaders that influence its industries, then we delve in detail in the results of 3 companies within our investment universe (composed by 34 at current moment - 13 Portfolio, 9 Watchlist, 12 Radar)
Tesla fell short of revenue estimates by 2.2%, its impressive 3-year revenue CAGR remains at 33.0%, down from 38.7% last quarter and 60.3% two quarters ago. EBIT also missed by 9.1%. Furthermore, it failed to meet $0.74 earnings per share (EPS) estimates by $0.03 and 18.1% GAAP gross profit margin estimates by 50 bps. The GAAP EPS was significantly impacted by a roughly $6 billion tax benefit, rendering it an irrelevant metric for the quarter. Tesla expects notably lower volume growth for its auto business in 2024 compared to 2023 and anticipates $10 billion in capital expenditures, reflecting a 12.3% year-over-year growth. Currently, Tesla trades at 57x next 12-month (NTM) EBIT, 55x NTM FCF, and 61x NTM earnings, with EBIT, FCF, and earnings projected to grow year-over-year by 49%, 55%, and 44%, respectively, in 2024.
ASML reported strong 4Q23 results, with revenues hitting €7.24 Bn, exceeding expectations, and earnings per share at €5.21, higher than forecasted. Full-year 2023 revenues reached €27.56 Bn, with earnings per share of €19.91, reflecting significant growth from 2022. The gross margin improved by 0.8%. ASML's orders tripled, totalling €9.19 Bn in the fourth quarter, driven by robust demand for advanced equipment, fuelled by strong Chinese demand, which accounted for 39% of sales. (ASML specialises in semiconductor equipment manufacturing, particularly lithography (crucial process for imprinting fine patterns onto silicon wafers used in chip production) where it has a worldwide monopoly. Its clients are Taiwan Semiconductors, Intel and Samsung)
Netflix added 13.1 million subscribers during the 4Q (260.8 MM paid subscribers in total) surpassing estimates by 38%. Average revenue per member (ARM) increased by 1% YoY. Netflix exceeded revenue estimates by 1.4% due to foreign exchange gains and strong member growth. Its 10% 3-year revenue CAGR slightly surpassed last quarter's 9.9%. Also beat GAAP EBIT estimates by 23% and FCF estimates by 29.5%. Guidance for 2024 expects healthy double-digit revenue growth and high single-digit content amortization rise. The company aims for $6 billion in 2024 free cash flow, allocating $17 billion to content spend compared to $13 billion in 2023. Netflix is a clear example that even geniuses (like Bill Ackman) can err sometimes.
American Airlines reported adjusted earnings per share of 29 cents, surpassing estimates but down significantly from the previous year's $1.17. Adjusted net income declined by 77% to $192 MM, beating estimates. Operating revenue totaled $13.06 Bn, slightly lower year-over-year but slightly above estimates. Passenger revenue decreased by 1%, while available seat miles and revenue passenger miles increased by 5.8% and 5.4%, respectively. The load factor decreased to 83.6%, and passenger yield dropped by 6.1%. Costs per available seat mile decreased slightly, while CASM excluding fuel increased. Passenger revenue per available seat mile also declined. The total number of aircraft at the end of the period increased by 4.1% year-over-year.
Next week (the most anticipated week in the earning season where around 20% of S&P 500 companies report):

Apart from comments on the main companies, we will cover in detail Good Times Restaurants, One Water Marine, Brunswick and Malibu.
Macro Data
United States
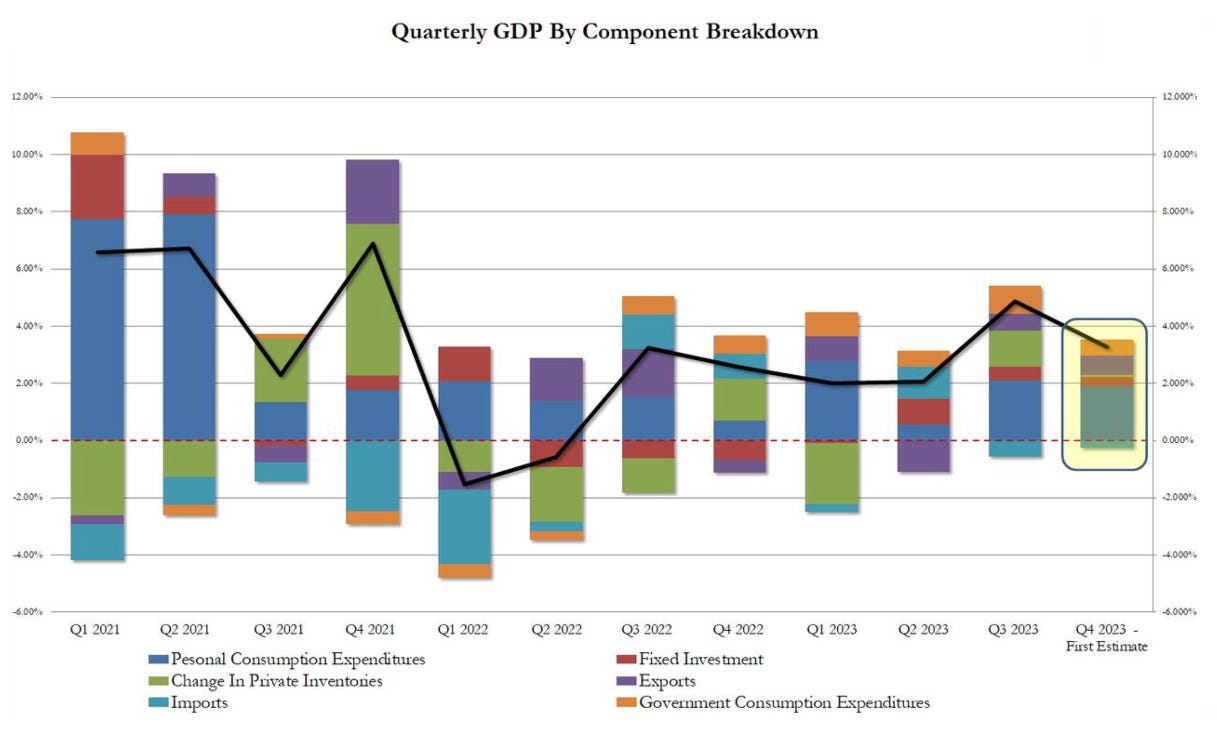
Very good economic data (with the exception of jobless claims) has helped the stock markets rise this week.
GDP QoQ 3.3% vs 2% expected
Core PCE (Personal Consumer Expenses) YoY +2.9% (expected 3%, previous +3.2%)
Initial Jobless Claims 214K vs 200K expected (189K Previous)
New Home Sales (Dec) 664K vs 645K expected and 615K previous
Manufacturing PMI 50.3 vs 47.9 expected and 47.9 previous
Core Durable Goods orders (Dec) + 0.6% (0.2% expected)
In the coming week:
Tuesday: JOLTs Job Data and Consumer Confidence
Wednesday: Fed Interest Rate Decision and
Thursday: ISM Manufacturing PMI data
Friday: January Jobs Report
Europe
UK Composite PMI: 52.5 vs 52.2 exp, Manufacturing PMI 47.3 vs 46.7exp , Services PMI 53.8 vs 53.2 exp (Very good data in the UK)
ECB Interest rate decision 4.5%, Deposit Facility rate 4% (both as expected)
For next week, we have prepared a dashboard and an explanation of the main economic indicators (leading & lagging) in an attempt to explain their importance to the market and how to interpret them.

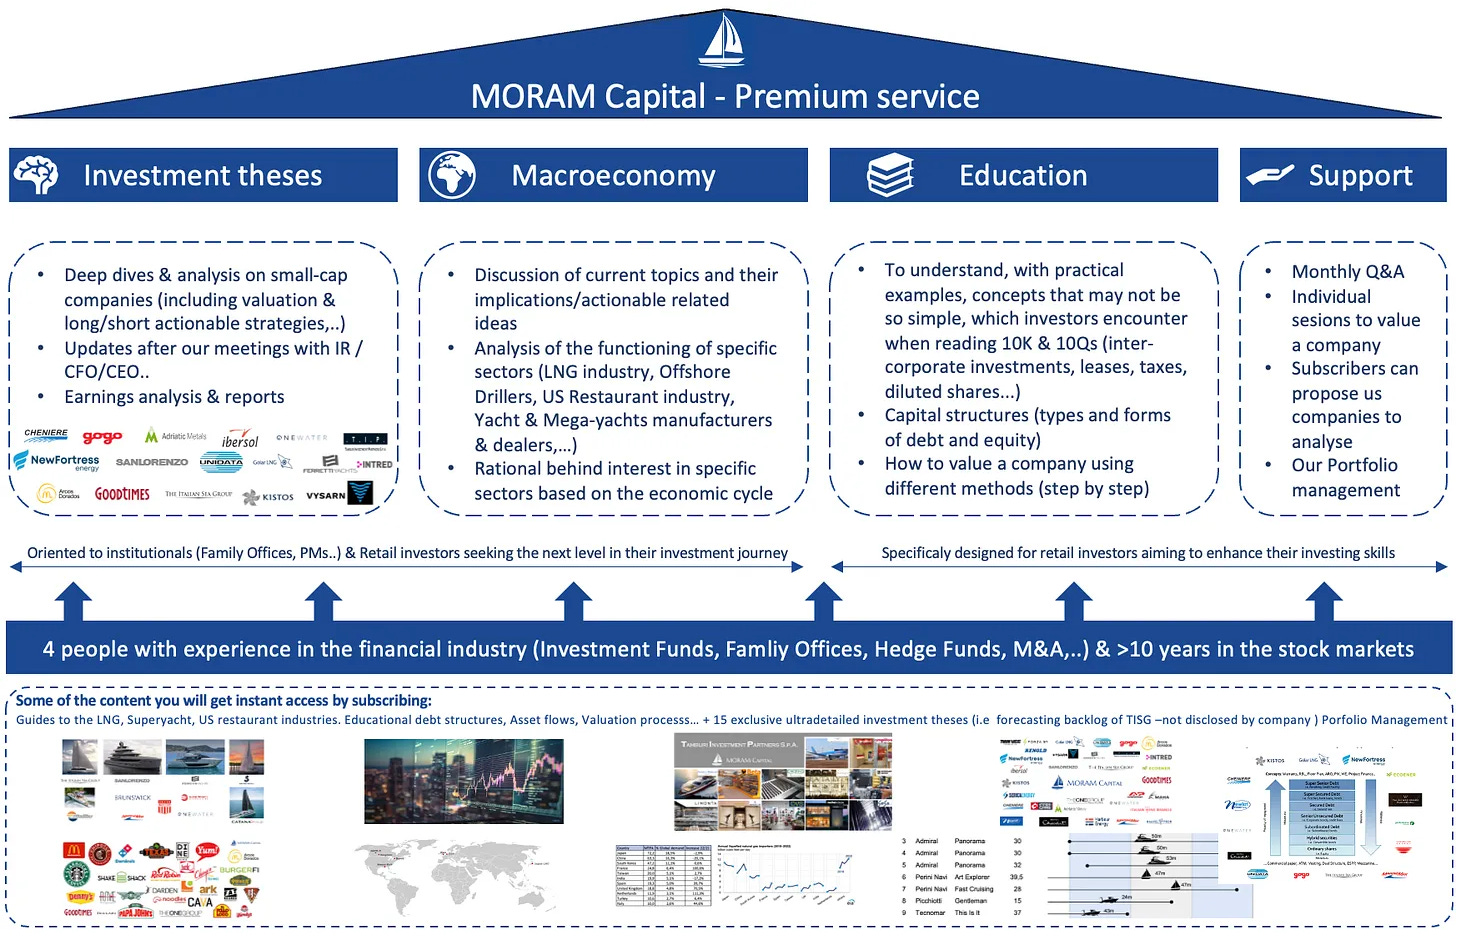
Thank you for reading! If you wish to become a premium subscriber and support our project, please do so through our website, where the prices are more attractive (as we use the same gateway - Stripe, but we have lower commissions). Upon registration, you'll gain access to:
Educational - Portfolio Immunisation (Fixed-income strategy)

Suppose you are managing the fixed-income portfolio of a commercial company and have to face a known large outflow in the upcoming years with a known amount but uncertain timing. How would you construct your portfolio to face this liability so that the fluctuation in interest rates doesn’t affect the value of the portfolio against the liability?
LDI is the strategy to cover future obligations with invested assets (usually in fixed-income securities) and is mainly used by institutional investors like pensions or insurance funds. However, this may also be relevant for commercial corporations seeking the coverage of debt repayments or defined-benefit pension plans, but also for individuals (supplement for the public pension, or a downpayment for an apartment, to say some examples).
One of the most common LDI strategies is immunization which minimizes the variance between the return of assets and liabilities. It may be seen as a special case of interest rate hedging. The goal of immunization is to protect investors against fluctuations in interest rates that may affect the value of their bond portfolio. We will see through the examples how to structure a fixed-income portfolio protected against interest rate changes through duration matching.
If we took the simplest example, let’s say a one-time downpayment for an apartment in two years, the maths and the portfolio construction would be simple: Invest in a high-quality (assumption: no-default risk) zero-coupon bond security for two years. For a $50,000 downpayment and a YTM of 4%, we would have to invest ($50,000(1+0.04)2)=$46,227.81As we are holding the security to maturity and the durations are the same, we have no price risk (ultimately the bond will be brought at par), and as we do not receive any coupon, we do not face reinvestment risk either. So, the interest rate volatility is ultimately irrelevant to us as buy-and-hold investors.
Unfortunately, the reality is a bit more complex. Despite being about three times larger than the equity market, zero-coupon bonds are not as common as coupon-paying securities. Moreover, we would have to find a bond with the same duration of the liability.
This is why, to immunize our portfolio we will have to construct a diversified bond portfolio with the following assumptions/ characteristics:
The market value of the assets is equal to or higher than the present value of the liability. As most of our readers are equity investors, you must be thinking: Then, why doesn’t the company repurchase the bond if they have enough funds? The answer is simple, bonds are not as liquid as equity, and many fixed-income investments intend to hold to maturity their securities. If the company intended to buy back the bonds, they would have to pay a premium and can synthetically do the same building a bond portfolio.
The Modified Duration is equal to the liabilities maturity date. The idea of doing so is that the price and reinvestment risk cancel out. * We have already covered the basics of fixed income in other posts, in case you feel you are missing something, you can always take a look in the portfolio management section.
It minimizes the portfolio convexity statistic. The biggest risk of the immunization strategy is the non-parallel shift of interest rates. To minimize this risk, we need to reduce the dispersion of the cash flows thus minimizing the convexity of the portfolio. To do so, we need to construct a laddered portfolio.
Let’s imagine you are the investment manager of a manufacturing company in Germany. Three years ago, your company decided to invest in a huge factory in the US, and to do so, the firm issued a 10-year zero-coupon putable bond.
Note: if we wanted to match the outflows of the liability with the inflows of the fixed-income portfolio, we should use a cash flow matching strategy. However, our objective is not this one but to be ready to repay the investors in case they use their put option. This is why they want to protect themselves against the fluctuations in interest rates.
Three years after buying the facilities and borrowing the loan, the company decided to shut down its operations in the US and sold the factory for $100MM in cash. As of today, 31st December 2023, the bond is trading at par with the following figures:

This (remaining) seven-year liability has the following time flow:
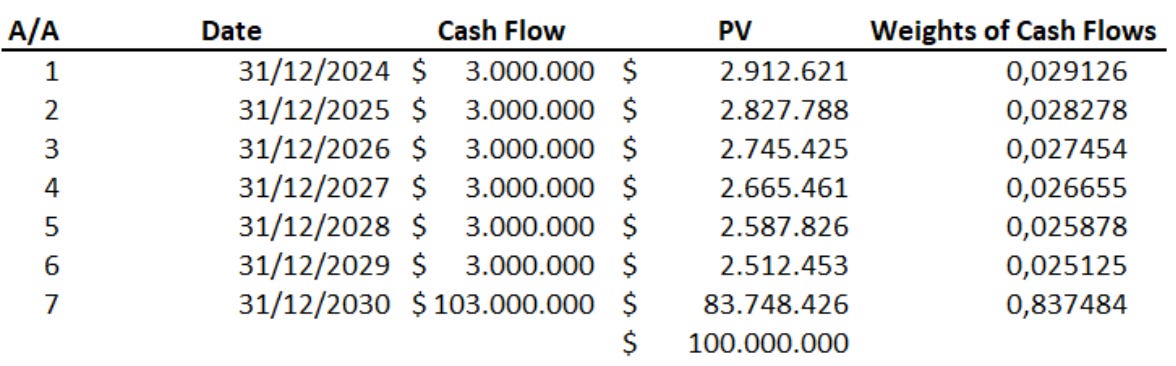
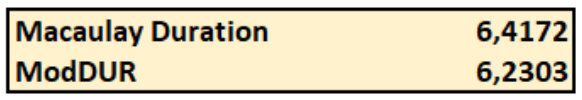
From the table above, you can obtain the Macaulay Duration and Modified Duration with the formulas =DURATION and =MDURATION, respectively in Excel.
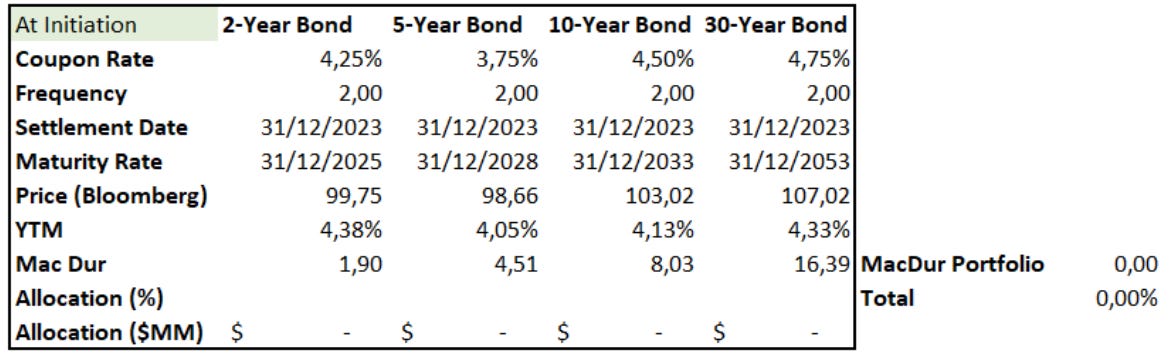
As we said in the beginning, this is a liability-driven strategy, thus, once the liability is quantified, we can build our fixed-income portfolio. Remember: Our objective is to match the duration of the liability with a portfolio of bond securities so that we have no impact from a change in the interest rates. As our liability was in USD, we will construct our portfolio by combining Treasury bonds of different maturities. You can find the current price and YTM of these and many more securities in Bloomberg.
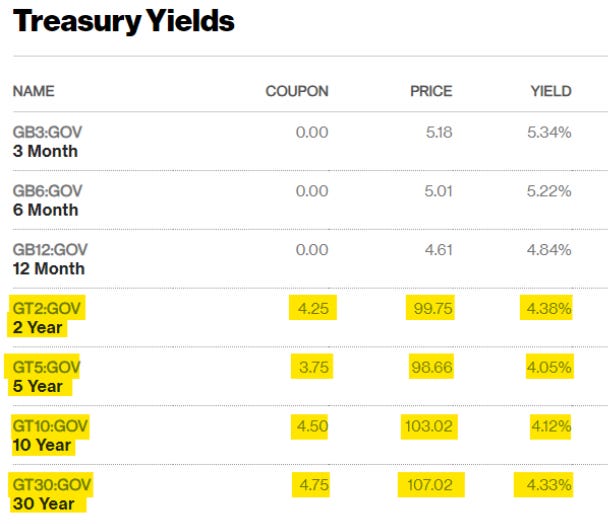
The screenshot of the bonds is dated 19th January, Assuming the issuing of the bonds was on 31st December 2023, and given the current market conditions, this would be the YTM (although it is given by Bloomberg we can double-check using the =RATE function and the Macaulay Duration.