


Fortress Infrastructure $FIP
A leveraged bet with massive short-term catalysts.
Hi there, we hope you had a fantastic week !
Please find this brief summary of the topics we are covering today
The Week in the Markets
Our weekly summary with the best charts to understand what happened in the markets in 1 minute, along with explanations for those who want to dive deeper.
Equities, Bonds, Currencies, Alternative Assets, Macro Data, company commentaries, Earnings Season, and much more!
Equity Research
Fortress Infrastructure – US Energy infrastructure company that spun off in 2022. It has four assets (in the Railroads, Power & Gas, and Ports & Terminals segments) and a massive list of short-term catalysts. A highly leveraged company (mainly at the asset level) that has dropped over 50% in the past 9 months due to delays in catalyst announcements (among other things). Extensive analysis of a company we have followed for a long time, part of our expertise in the energy infrastructure niche. Full analysis, independent valuation, strategy and thoughts
Italian Wine Brands – Our Italian wine company reported the best results in its history with an AEBITDA of €50MM(at an EV of 5.5x). However, many interesting insights were shared during the Conference Call, and today we provide our detailed analysis along with our objective reflection on its short- and medium-term future.
Portfolio Management
Including updates on our 3-stage monitor, comments on several companies, and our macro views, along with their respective movements in both equities and all asset portfolios (Excelerate Energy, Solaria, Golar LNG, New Fortress Energy,…)
Investor Resources
Data Center Update
Financial model Updates
Nota: Toda esta publicación está disponible en Español en nuestra web
Disclaimer: This publication is purely for education purposes and does not constitute any type of financial advice. Please consult your financial advisor.
The Week in the Markets
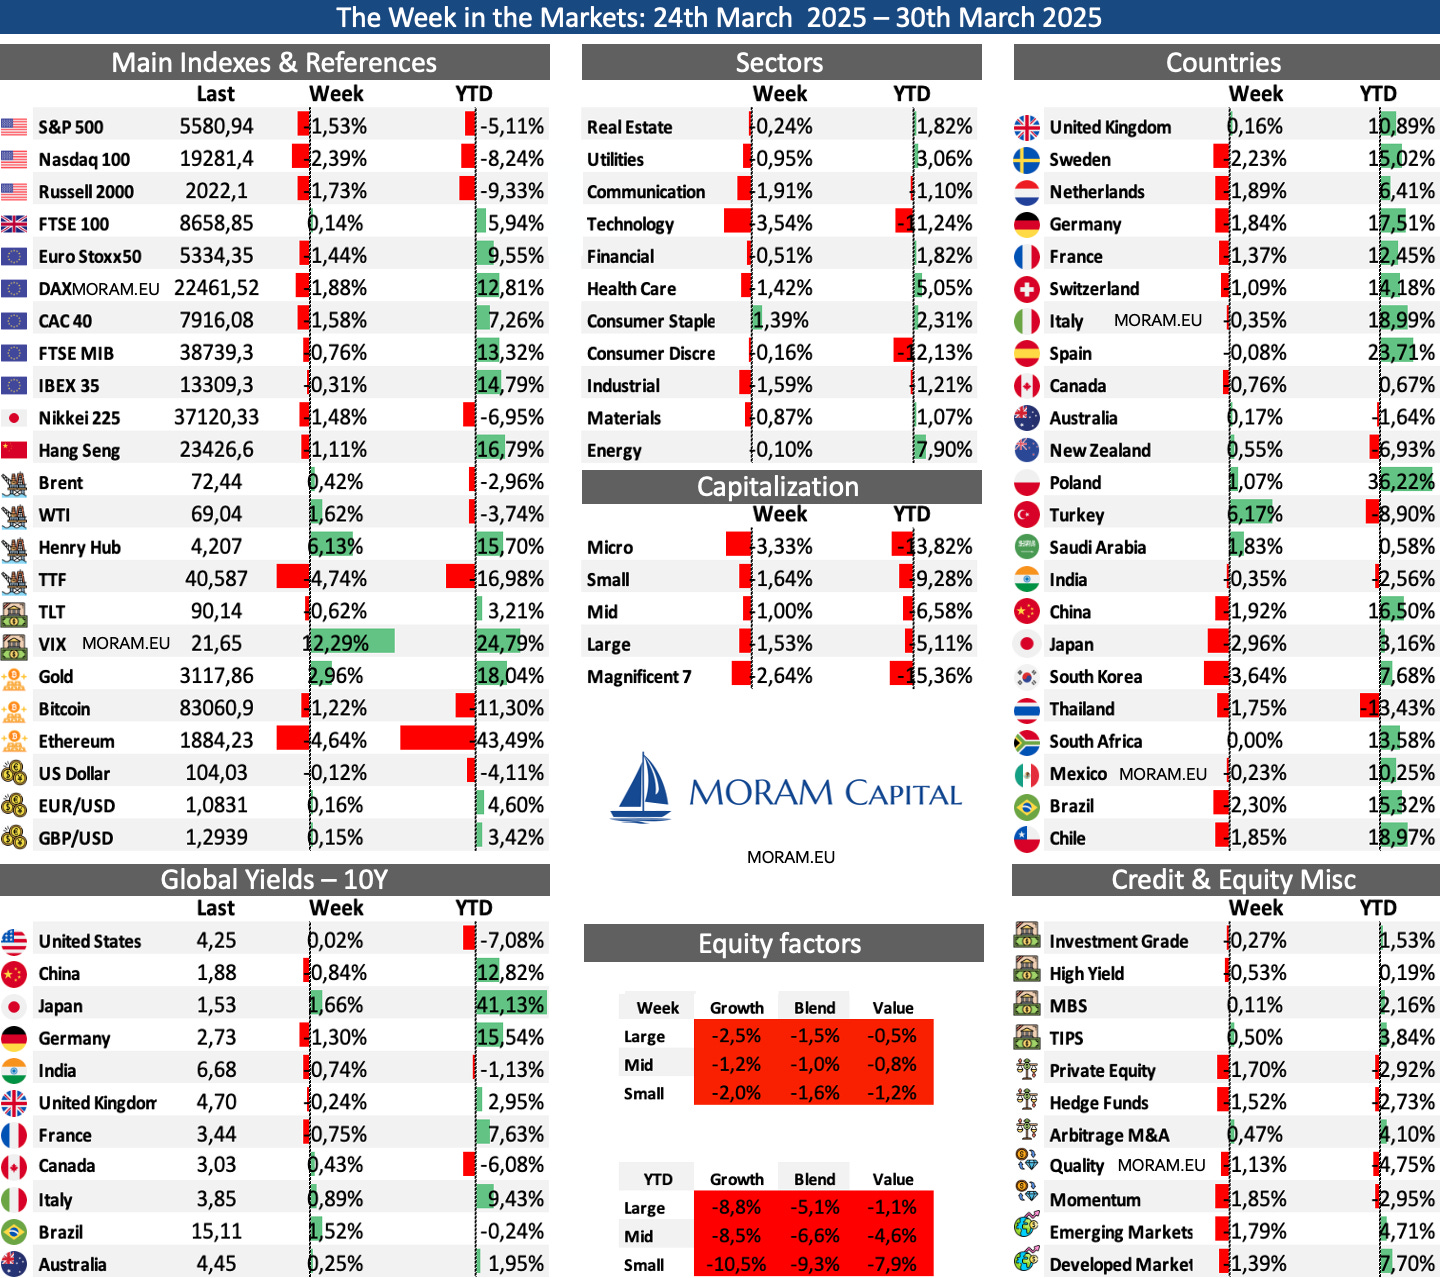
Summary
A week in which declines in the main indices have continued, mainly due to concerns about growth, the PCE macro data, and the tariffs confirmed on Wednesday. Both the S&P 500 and Nasdaq 100 are approaching very dangerous support levels—last time, just two weeks ago, they bounced from here, but if they break below, the correction could be much more severe.
The main drivers of the decline this year have been the Mag7, which are down more than 15% YTD (detailed breakdown below). Meanwhile, the S&P 500 Equal Weight Index (which, as the name suggests, assigns equal weight to all S&P 500 components—meaning the Mag7 do not make up 30% of it) is down only 1.86% YTD. This week, Nvidia and Alphabet dropped another 6%.
Another key theme in 1Q25, which has just one day left, is the significant outperformance of Value over Growth after three rough years. As seen in the equity factors table, the differences are quite pronounced—this is, in fact, the sixth consecutive week of outperformance.
Europe and China, despite this week’s declines, continue to significantly outperform the U.S. Over the first three months of the year, there's been a (small) rotation of flows toward countries implementing strong fiscal stimulus, such as several in the EU and China.
Gold remains unstoppable, surpassing $3,100/oz amid economic uncertainty. The VIX is rebounding sharply, once again exceeding 21. Going long on derivatives each time it nears 15 has been a highly profitable strategy in recent months—although this last time, it didn’t even get there.
Bitcoin, which had recovered to nearly $90,000, is now ending the week (Saturday morning) below where it started.
At the country level, Poland continues to dominate as the top performer (MSCI Global—which differs from the WIG 20, the Polish index, seen in a later section). In 1Q25, the top-performing regions have been Europe, China, and emerging markets.
Looking ahead to the coming week, corporate earnings will be quiet, as earnings season has essentially wrapped up, and the first 15 days of April are typically slow in this regard. However, US PMI data will be released throughout the week, with the key event on Friday—the employment data, which will likely set the tone for markets.
Macro highlights
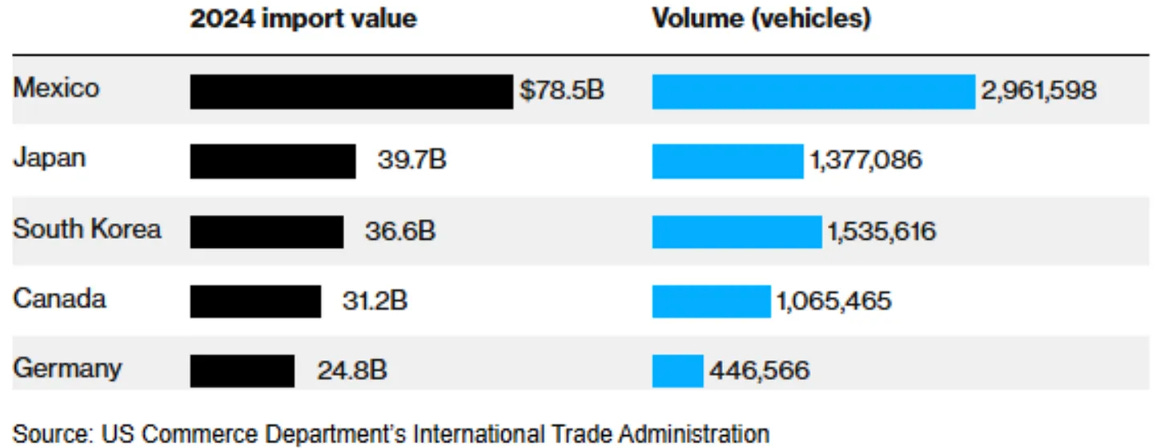
Tariffs
Trump announced a 25% tariff on all imported cars, effective next week. He also stated that higher tariffs could be imposed on the EU and Canada if they coordinated efforts against these measures.
Initially, the tariffs will apply to fully assembled vehicles, but by May 3, they will extend to key auto parts, including engines, transmissions, propulsion components, and electrical systems, with the possibility of further expansions if needed.
As you can see in the image below, Mexico Japan & South Korea are the countries most impacted by the measure
PCE

The PCE, recognized by the Fed as its preferred indicator for interest rate decisions, was released this Friday and came in higher than market expectations. This put pressure on major stock markets, leading to significant declines.
PCE increased 0.34% MoM, maintaining the same pace as the previous two months. Services were the main driver of the acceleration, rising 0.4% MoM, while goods saw a more modest 0.2% MoM increase.
Core PCE, the Fed’s preferred inflation gauge, rose 0.37% MoM in February, its largest increase since January 2024, pushing the YoY rate to 2.8%
The SuperCore PCE (services excluding housing) climbed to 3.34% YoY.
On the consumer side, personal income jumped 0.8% MoM, beating expectations, while personal spending grew 0.4% MoM, slightly below forecasts.
Inflation-adjusted spending edged up 0.1% MoM, with a rebound in goods offset by a decline in services. The gap between income and spending pushed the savings rate to its highest level since June 2024.
Consumer Confidence
Consumer confidence fell sharply in March, with expectations hitting a 12-year low. The Conference Board's indexdropped to 92.9, while the expectations component fell to 65.2, signaling recession risks. The University of Michigan’s sentiment index also declined 12% MoM to 57.0, with rising concerns over the economy and inflation expectations climbing to 5.0%, the highest since November 2022.
US GDP
The GDP for the fourth quarter of 2024 was revised upward to 2.4%, surpassing the previous estimate of 2.3%. This improvement was mainly due to trade and a downward revision of imports, rather than stronger consumption. Growth was driven by consumption and government spending, although investment decreased. Inflation was moderate, with the GDP price index rising 2.3% and the core PCE rising 2.6%.
Europe PMIs
The Eurozone showed slight improvement in March, with manufacturing reaching a 26-month high, while services declined to a 4-month low. Overall, growth remained marginal but improved from February. Germany's manufacturing sector rebounded, with output rising for the first time since March 2023, though services weakened. Meanwhile, France saw a notable improvement in manufacturing, but its services sector remained weak. Despite Germany outperforming France in March, over the past two years, French industry has declined by just ~1%, while Germany’s has dropped ~8%, leaving Germany with more ground to recover. With Europe increasing investment in defense and infrastructure, including Germany’s historic fiscal package, a more sustained recovery could be on the horizon.
Germany: Manufacturing PMI at 48.3 (prev. 46.5), Services PMI at 50.2 (prev. 51.1)
France: Manufacturing PMI at 48.9 (prev. 45.1), Services PMI at 46.6 (prev. 45.3)
Interesting Data about markets this week & YTD


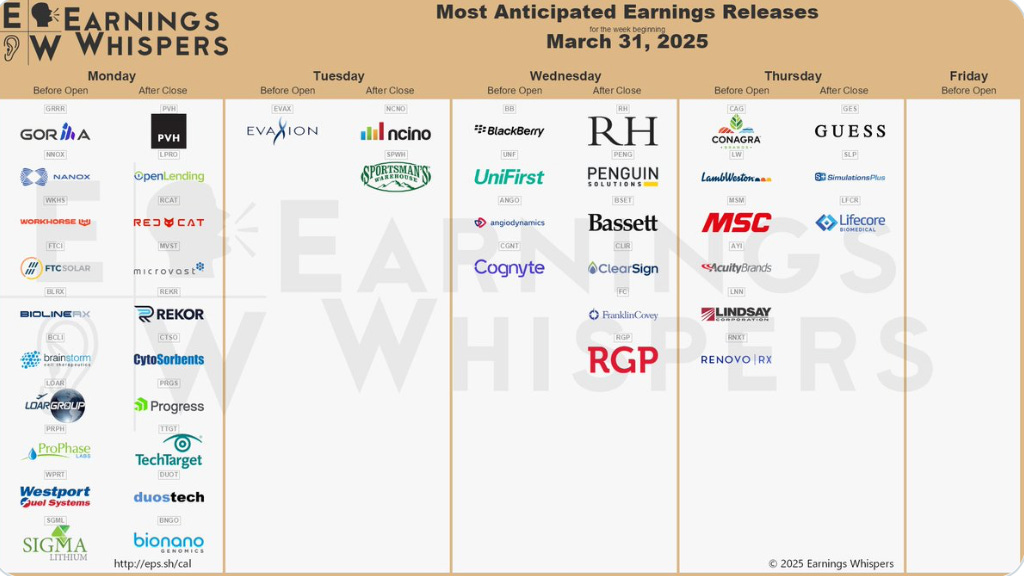
Earning Season 1Q25
Very slow week ahead as earnings season comes to a close. After two weeks of calm, banks and airlines will begin reporting their 1Q25 results.

Fortress Infrastructure - Analysis
Fortress Infrastructure ($FIP) is an energy infrastructure company born from the spin-off of its parent company, FTAI, in the summer of 2022, separating the Transport & Aviation Parts business from the Infrastructure business.
FIP’s business focuses on acquiring, developing, and operating critical energy infrastructure assets in the United States. Specifically, FIP owns four assets and has several minority investments.

Except for Transtar (a railroad business with stable annual growth of 10-15%, acquired in July 2021, and the company's main driver with nearly $100MM in EBITDA), since going public, FIP has been completing the construction and ramp-up of its other assets, securing long-term stable contracts.
In February of this year, FIP executed a major corporate move by acquiring the remaining 50% of Long Ridge (Power & Gas terminal) and eliminating low-price electricity swaps, raising them from $28 to $43/MWh. These actions, along with the results of an auction, project a run-rate EBITDA of $160MM (vs. $40MM in 2024).
Meanwhile, Jefferson is building a second hub and ramping up its main terminal (new contracts increasing EBITDA by 50% vs. 2024). Lastly, Repauno Phase II is scheduled for COD by late 2026, and with already signed contracts, it is expected to see a significant jump of $50MM EBITDA from its currently slightly negative EBITDA.
Overall, FIP’s EBITDA is expected to triple within the next 18 months (to over $350MM) while carrying out multiple financing cost reduction operations (its current financing ranges from non-tax bonds at 1.99% to preferreds at 14%, which it is trying to eliminate).
Despite this, FIP has dropped over 50% in the past 9 months, mainly due to delays in key initiatives and debt refinancing. As we will analyze in great detail, debt refinancing is the critical point to fully understand in this potential investment opportunity. Currently, FIP trades at a $530MM market cap and an EV of $3.7B.
Today, we take an in-depth look at Fortress Infrastructure, focusing on its complex capital structure to determine whether this presents a massive investment opportunity (analyst estimates suggest nearly 200% upside from current prices) or whether delays in contract announcements and refinancing are killing the equity story, considering the company's balance sheet.
A company in our niche of expertise, which we have followed since its IPO, where we aim to go one step beyond the market and consensus analysis.