MORAM Capital 2.0 - Financial Models, Reports, Data & Tools
MORAM Capital 2.0 - Financial Models, Reports, Data & Tools
It's time to take a big step forward
Hi there!
This week we have an important announcement to make, which we have been working on for the past few months.
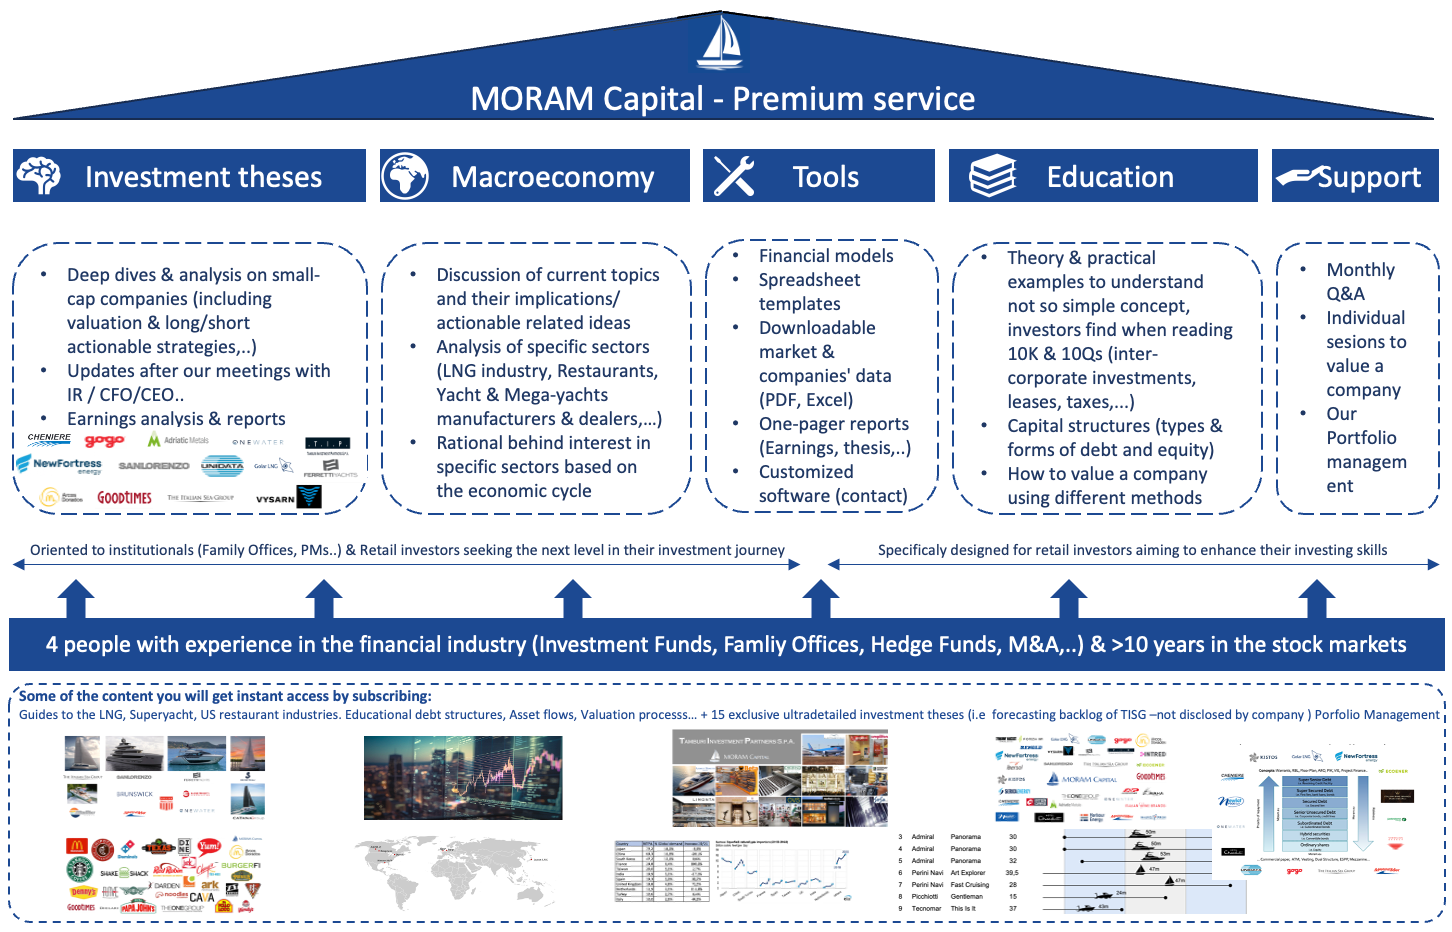
The Week in the Markets: One pager with a concise summary of the markets plus the highlights of the week regarding macroeconomy, liquidity, commodities, Middle East, Earnings season.
Financial models, reports, data, and investment tools are now available on our website. These additions follow a series of investments we have made in recent months to access high-quality data and software, enhancing our service at no extra cost for current subscribers. In the coming weeks, we will continue to expand the catalog of available resources, iterating and continuously improving the new features.
Portfolio Management Including updates on our 3-stage monitor, comments on several companies, and our macro views, along with their respective movements in both equities and all asset portfolios (New Fortress Energy, Emma Villas, Good Times Restaurants, Catana… updates)
The Week in the Markets

Week marked by the US inflation data surprising to the upside, leading to a new downward revision of market expectations regarding the Fed's rate cuts this year. This sharply impacted the markets across various levels. The dollar surged against other currencies as it is inferred that other central banks (Europe) are still planning to cut rates in June. US Treasury yields rose significantly, especially short-term ones (i.e., 2Y), and equities experienced a strong market retreat overall, with smaller companies being particularly affected.
In terms of sectors, Real Estate took the hardest hit as it diverged from the rest of the sectors on Wednesday, and by the end of the week, Financials joined it in the negative territory with the wave of first-quarter earnings reports, where JP Morgan fell by almost 7%. The VIX (fear index) touched 19 in yesterday's session and closed the week finally advancing by 8%.
Few positive developments, but the Mag 7 continue to advance, led this week by Apple and Alphabet, both rising more than 3%. And Gold continues to mark new highs, as we discussed last week, something is breaking as this behavior of gold is not normal in this environment.
The European TTF regained ground and exceeded €30MWh, helped by Russian bombings on underground storage facilities in Ukraine, ongoing tensions in the Middle East, and the advances of the European Parliament to provide member states with a framework to halt imports of Russian goods. However, the new figures for industrial natural gas demand in Spain, Germany, and much of the eurozone continue to struggle.

As we can see in the graph, despite its good week, Tesla has already fallen significantly behind the rest of the Magnificent 7 group.
Highlights of the week

In March, the CPI data indicated that headline prices increased by 0.36%, remaining consistent with the previous month's rise, contrary to the consensus expectation of a slight decrease from the previous month. The rise in medical services prices (from -0.1% in February to +0.6% in March) contributed to this, as did a significant increase in transportation services costs, which rose by 10.7% over the past 12 months, primarily due to higher car insurance costs. Overall, inflation increased by 3.5% over the past 12 months, marking its largest gain since September.
Of even greater concern could be the significant rise in supercore inflation, a measure that excludes energy and housing costs from services prices, which policymakers recognize as a lagging indicator of overall inflation trends. Supercore inflation surged by 0.7% in March and by 4.8% over the last 12 months, exceeding expectations by a substantial margin and marking its largest increase in 10 months.

The following day, Thursday, the PPI was reported and surprisingly came out lower than expectations meaning that industrial prices were rising at a slower pace than expected (in other words, sending the opposite message than Wednesday's CPI). PPI increased by 0.2% vs 0.3% expected and significantly lower than February's 0.6% rise. Input goods prices decreased by 0.1%, maintaining a trend of goods deflation that had been interrupted by a 1.2% surge in April.
However, and not to be suspicious, but upon closer examination of the data, we see that they have reported gasoline prices as -3.6% for the month seasonally adjusted, when the actual increase has been 6%. These peculiar adjustments prevented the year-over-year PPI from being 2.4% instead of 2.1%.

All of this translates to the market now only pricing in 2 rate cuts in 2024 (remember we started the year with the market pricing in 6), a factor that alone explains the performance divergences that different assets have been experiencing so far this year (see initial table).
Middle East escalation
During this weekend, the feared escalation of tension in the Middle East has occurred. Iran has launched missiles from its own territory to Israel for the first time in history, and according to the latest information, a response from Israel is expected in the next 24/48 hours. The markets that opened today (Saudi, Israel, etc.) have had relatively little movement in response to the news (the vast majority of missiles sent by Iran were deactivated by Israeli defenses). However, it is true that a market with much more volume, such as crypto, plummeted as soon as the news was announced. We will discuss implications for oil, gold, Treasury yields, and more later on.
European Natural gas

As we mentioned earlier, the increase in TTF prices is purely driven by geopolitical factors rather than fundamentals. As can be seen in the charts, the current inventory situation (from the perspective of investors in European natural gas upstream assets) is the worst in recent years. In addition to the widely discussed expansion of export facilities in Qatar, which is expected to be connected by the end of next year.
The elephant in the room is the terrible loss of competitiveness of the German industry, designed to rely on cheap Russian natural gas, which now, having to come by ship, is considerably more expensive, reducing industry margins (despite all the headlines of price drops from the peak, it's important to understand that the cost of shipping it is much higher than that of the pipeline, and it's unlikely that we'll see pre-conflict prices again. i.e. previously €13-17MWh and now, even though storages are fuller, it doesn't drop below 25 - currently at 30).
China
China's consumer price index (CPI) in March showed a modest 0.1% increase compared to a year earlier, down from February's 0.7% rise, mainly due to a decrease in food costs after a temporary increase during the Lunar New Year holiday. Core inflation also rose, but at a slower pace of 0.6% compared to February's 1.2% increase. On the other hand, the producer price index (PPI) fell by 2.8% year-on-year, marking its 18th consecutive month of decline and accelerating from February's 2.7% drop.
In addition, trade data for March revealed a significant decline in both exports and imports, reversing the gains seen in the first two months of the year. Exports contracted by a worse-than-expected 7.5% compared to a year ago, while imports declined by 1.9%. This setback in trade figures has raised concerns about China's economic recovery and has put pressure on Beijing to implement further stimulus measures to achieve its 5% annual growth target set at the National People's Congress in March.
Earnings Season
This week marks the beginning of the 1Q24 earnings season, led by banks and airlines.
JPMorgan Chase: The net interest income was lower than expected. CEO Dimon attributed the decline to deposit margin compression and lower deposit balances. They reiterated their view on net interest income for the fiscal year but fell short of expectations for an increase. Its share price crashed almost 7% on Friday after reporting.
Wells Fargo & Co exceeded expectations in both revenue and earnings, but net interest income and net interest margin fell short. Looking forward, they stated they expect net interest income for fiscal year 2024 to decline between 7% and 9%.

Note: Both this earnings report for the upcoming week and the dividend report, market information, and other reports we are sharing today on our website are initial versions. We will iterate and continue improving them in the coming weeks.
MORAM 2.0 Financial Models, Reports & Data

This Saturday marked four years since the launch of this project, which has been in constant evolution since day one. The core of this project has been and will always be company analysis, but it is true that we have been thinking for quite some time about how to offer greater added value to subscribers, trying to go one step beyond. To do this, we created the following mandate, whatever the new thing was, it had to meet three conditions.
Increase the quality and depth of the analyses even further than current.
Provide subscribers with structured access to as much market information as possible.
Enable the means, in downloadable format, for subscribers to use them at their discretion whenever they want.
And the solution lay in something we had been quite hesitant about until now, Data. With the exception of the period with access to Bloomberg, derived from Carlos's experience in a London Hedge Fund, we have always handled this aspect quite manually (searching for 10Ks, 10Qs, SEC filings,..) and typing the info in Spreadsheets along with our notes about the company, questions, conversations with its management, Misc section.. to develop our financial models. Mainly because every time we tried to streamline this process using TIKR or other similar providers (we have nothing against TIKR, in fact, it is quite competent), we ended up spending more time validating and correcting data than exporting the SEC filings from the companies websites and doing it ourselves.
But this has recently changed. After several months of searching, interviews, and trials, we have finally decided to take the leap and make a significant investment in the same data provider used by some of the world's leading investment firms. In addition, we have added a part-time programmer to the team with the aim of maximizing the opportunity that presents itself.
We have plenty of ideas in mind that we want to implement gradually in the coming weeks/months, and without wanting to set expectations too high, we think it's reasonable to expect:
Sectoral analysis with quarterly updates and data from all companies included in the analysis (PnL, BS, CF,...) including sector specific metrics and comments
Earnings and Dividend Calendar, Screening tools….
One-Pagers with our comments on earnings/conference calls including the main data reported by the company and a summary of the company
Downloadable Excel templates for financial modeling specific to different sectors to different sectors
The Week in the Markets with all information on commodities, currencies, ETFs, debt, macroeconomic data... downloadable as a PDF
Excels with all historical data of any company traded in the world / whatever you request
Specific and customized software for portfolio management (integrating SEC filings alerts, etc.) aimed at Institutional investors
New ideas that occur to us along the way, we're realizing that the possibilities are practically limitless.
In addition to financial models, as before, already available on the website (we have also taken the opportunity to significantly increase the website space to facilitate the storage of all resources there and add Project Finance, M&A, or LBO models for educational purposes based on the knowledge acquired by different team members in previous job stages.
An important point we want to emphasize is that just because we can automate certain parts of the process - with highly reliable data - does not mean we will cover more companies.
We believe the differential value lies in understanding and knowing the companies we analyze and publish perfectly. And this is where we want to be different, in publishing high-quality analyses, as it is the project's raison d'être, and now also providing investors with a full pack of Excel tools and PDF reports, facilitating access to a wide range of information about financial markets, helping them better understand and delve deeper into the analyses we publish, and providing them with the necessary tools to search for and analyze companies themselves.
And of course, just as we said a year ago when we launched the Premium project, our goal is to reinvest the profits for the benefit of subscribers. That's why all these improvements will be included at no additional cost to our current subscribers
And to new ones?? Until May 1, neither.
MORAM.EU - Financial Models, Reports, Data & Tools

Thank you for reading! The rest of the article is for our premium subscribers. If you wish to become a premium subscriber and support our project, please do so through our website, where the prices are more attractive (we use the same gateway - Stripe, but we suffer lower commissions). Upon registration, you'll gain access to: