


Renold $RNO.L + TISG Meeting & Backlog mapping + Earnings (boat manufacturers
Probably, the first thesis ever published about this small cap with full potential

Hi there,
Today, we have a publication we are very proud of. We're not only sharing the TISG backlog mapping but also publishing what we believe is the first thesis on Renold available on the internet.
We are sharing the investment thesis in Renold, the second largest industrial chain manufacturer worldwide, setting record revenues in FY23, order book & start of FY24. Clear acquisition strategy in an industry ripe for consolidation. Trading at <5x earnings
Comments on the companies in the recreational boating industry that have reported this week (Marine Products, Marine Max, Brunswick..
Our latest interview with TISG, in which we include our mapping exercise of their backlog, with start and end dates for each of its 22 yachts under construction, yacht types, detailed backlog by yacht, and net backlog for 2023, 2024, and 2025. This has been a tremendous effort since the company does not break down this information, and it was conducted through extensive research of publicly available information. We have also proposed to them that they publish it in their quarterly reports as their competitors do, but we don't know if they will do so.

Moram Capital is composed of financial industry professionals, most of whom have been in the financial markets for more than 10 years. We publish company analyses (actionable long/short ), macro/market analyses and financial education content. We also share our portfolio management, which we believe is valuable in the current market environment. Additionally, we have monthly Q&A sessions, valuations step-by-step sessions , publish practical examples about Debt, Asset allocation,…
Become a member of our community and gain immediate access to all of this content, both on our website and on Substack.
If you have any questions, please don't hesitate to reach out to us at info@moram.eu


Earnings comments - Recreational boating industry
As you know, we like to analyse and understand entire industries rather than individual stocks. That's why, depending on the macro environment, when we start analysing an industry, we often publish several companies. Currently, we are quite active in the consumer discretionary sector, specifically in restaurants (you could see on our Substack the analysis of the US restaurant industry and the investment thesis in One Group Hospitality published this October), boat manufacturers and dealers (we have been covering this industry for a little over 6 months), ultra-luxury yachts, and natural gas. However, analysing an industry does not necessarily mean that we are invested in the companies. Sometimes we are, other times we may be short, or we may simply not have exposure (as we share with the premium subscribers). Likewise, we cover / have exposition to other companies with special/different situations and mainly follow the macro and the markets to take decisions. When we share any analysis, we try to be as objective as possible, and our liking a company doesn't necessarily mean that we have to be in a long position (we may simply think it's not the right time).
That said, one of the sectors we have spent a lot of time on in recent months and believe we understand quite well (at least so far it's been going well, which can obviously change) is the recreational boating industry, which is relatively small in terms of publicly traded companies. This week, the first three companies in the US reported: Bruskwick and Marine Products (manufacturers) and MarineMax (a dealer - for which you have an analysis published on Substack).
Marine Products: Results were weak, missing estimations (Rev $77,8MM -22% & EPS $0,3 -14%) even with the sale of the Real Estate (+$2MM). Nevertheless, the company has a strong Balance sheet to easily weather the downturn (we expect it to last at least the next few quarters).
We believe it's somewhat expensive compared to the rest of the sector, but it's incredibly useful for trying to anticipate how the quarter has gone for the rest of the companies. This is because it's the first to report, and you can try to deduce how the market has performed for both dealers and manufacturers (dealers are clients of the manufacturers, so they have different business models, and events affect them differently).
Something we highlight is that the manufacturers’ optimism from previous quarters regarding dealers needing to replenish their inventories has faded. They now assume that with current interest rates, dealer’s inventories ‘ll remain around 60-65% of pre-pandemic levels
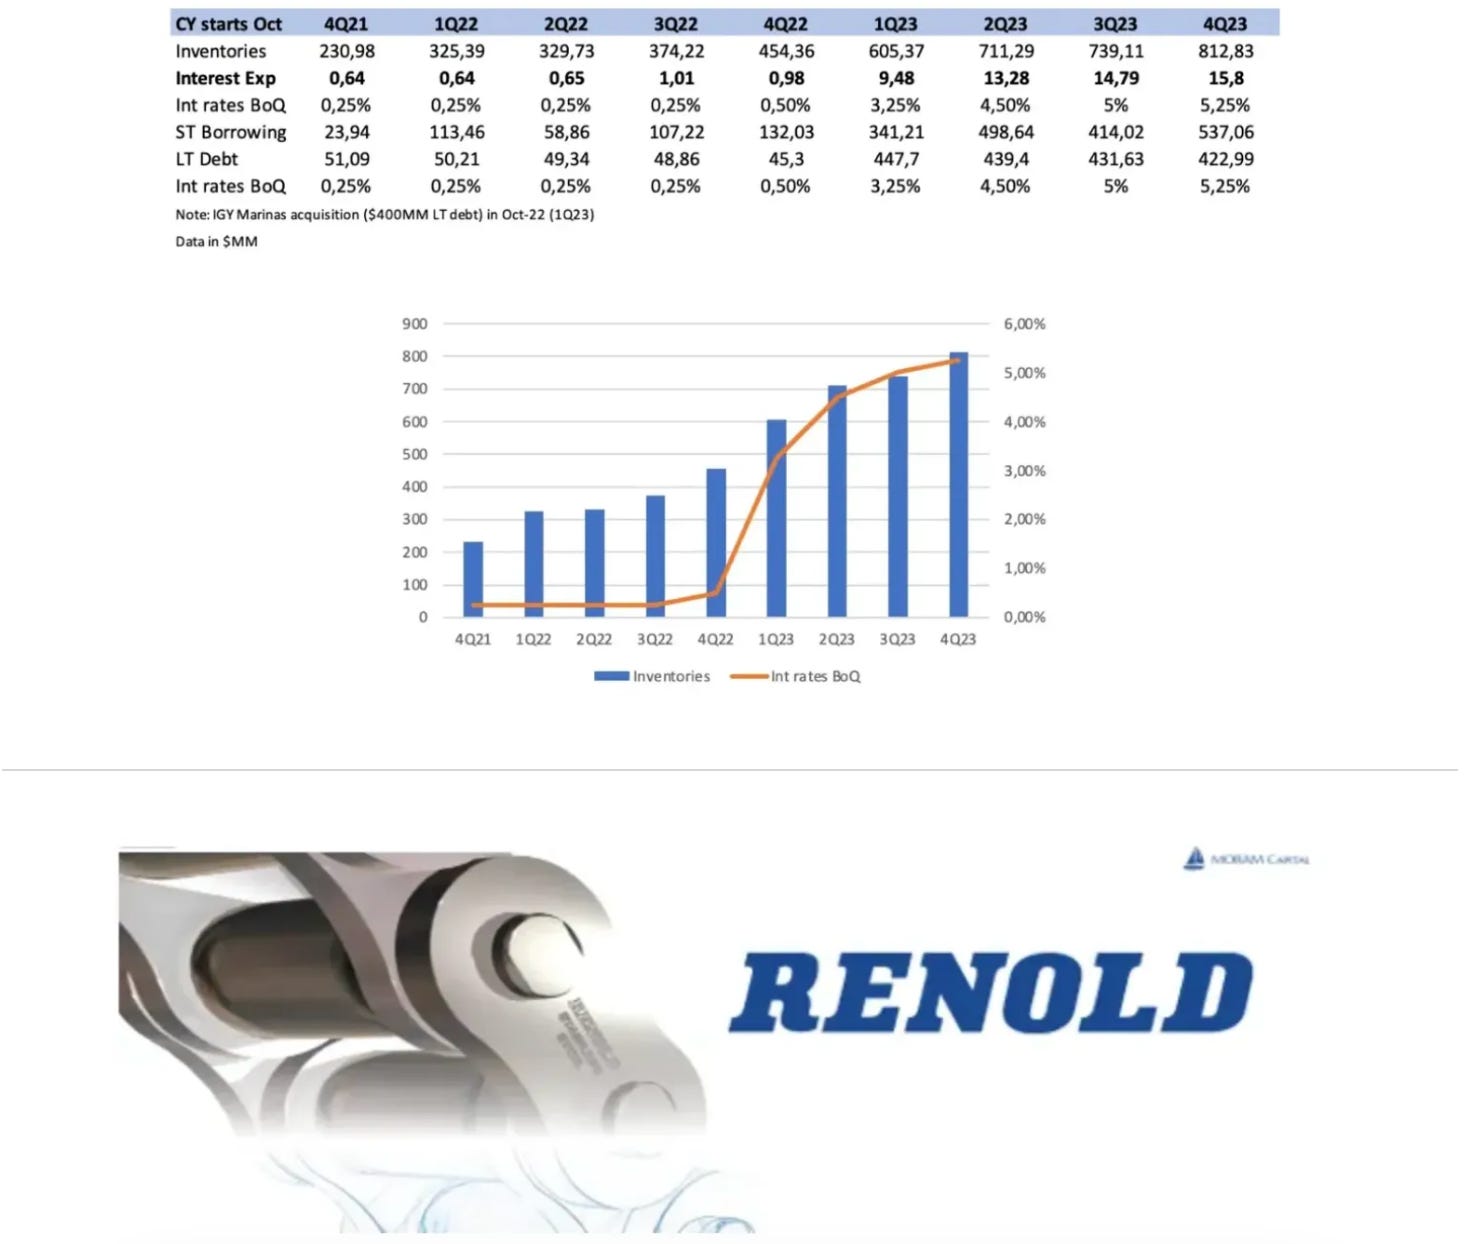
Marine Max: It was a positive surprise with the increase in same-store sales (+8%), and sales were better than expected (selling longer boats and price increases). However, inventories have continued to rise (in a normalized environment, they decrease significantly in 3Q - which didn't happen - rise little to none in 4Q, and are restocked in 1Q & 2Q (calendar year starts in Oct). We find their guidance of $4.75 EPS somewhat optimistic, especially if $70 million is allocated to interest expenses. When they publish the 10K, we will see the details of their IGY Marinas business, which is expected to perform well in this environment, and the service segment to finalize our forecast. Obviously, even at $3.75-4, it's still undervalued, but market sentiment is a disaster, and we hit the short position perfectly, as we discussed with the results of Marine Products when HZO reported the next day. They are very similar technical situations. You can find all the details in the analysis and updates published, and we will continue to monitor it closely.
What is Renold and why are we talking about it today?
Renold is a London-listed ($RNO.L) high-precision chain and power transmission company with a worldwide presence with almost 150 years of history. The footprint of Renold extends throughout the globe and covers a vast range of industries going from food production to waste management but also entering into more innovative sectors.
The company is positioned in the premium segment with their price being around 10-15 times more expensive than the lowest price but with a better product that reduces the total cost of ownership. It is the second largest competitor in a fragmented market where most of the competitors play locally. Renold has a clear intention of being a key player in consolidating the industry.
We want to analyze in detail if there is any hidden risk or dark spot for a company with growing profitability, a record order book, and interesting opportunities to grow organically and through small/medium acquisitions, trading at less than 5x earnings (£63 million market cap). Setting aside the low multiple attributed to companies listed on the London Stock Exchange (although this geography only represents 7% of revenues), we will mainly focus on dissecting critical aspects such as their pension liabilities, the cost structure, and the long-term strategy.

History
Renold was founded in 1879 and is the oldest established transmission chain company, throughout the years it has marked important milestones in the development of the precision chains industry. It was the first company to introduce bush roller chains in 1880, a design that is still used.
During the 19th and 20th centuries, the innovation and issuing of patents by Renold were constant in an industry to be developed during these years. The acquisitions were also usual both in the UK and in other European countries like Germany.
Within the final years of the 20th century, Renold started having even more relevance in international markets such as the US and emerging markets. In 2000, the company launched its high-performance transmission chain, Renold Synergy which continues to be the flagship brand.
Renold has not changed substantially in the last couple of years, the core business remains the same but we think they have taken adequate steps to become more profitable and resilient. In 2006, they sold the Machine Tools and automotive business in order to reduce the bank debt which was uncontrolled. Moreover, Renold was a very small player in a more cyclical industry and did not manage to be profitable. This was part of the more global strategy of reducing costs and opening new factories in developing countries. This came along with a significant headcount in Germany and the UK.
With a healthy balance position, their products continue to have great demand from end users. During the last years, the company has acquired 3 businesses that was very infrequent during the restructuring. We believe Renold is now in a good position to capture more share in a moderately growing market while increasing profitability.
What does Renold do?
Renold manufactures in 8 countries, having the main factories in India, China, the US, and Germany, and operates in 18, with sales in more than 100 countries. The group’s global presence shortens the supply chain and enables the company to respond better and faster to customer demands. It is one of the reasons it was not heavily affected by the supply chain disruption.
Renold competes in two differentiated divisions: Chain & Torque Transmission. The Chain division accounts for around 80% of revenues with higher returns on sales. Within each division, there are multiple brands, each of them targeting different levels of specificity.
Almost whatever industrial activity makes use of multiple chains, just to mention a few, they are present in agricultural machinery, and food production but also in the energy sector, warehouse automatization (as an example an AI company contracted them for the automation of the warehouse), or theme parks.. The company divides the types of chain between the following. The most commonly sold are the Transmission and Conveyor chain.
The global presence and the wide range of selling points make the portfolio of customers to be highly diversified. No customer represents more than 3% of the group’s revenue. By sector, Renold is also well diversified, the revenue per sector is split as follows:

By geography, 80% are in developed markets (42% Americas, 38% Europe) meanwhile the rest of the sales are split equally between Asia Pacific and other Emerging Markets. This distribution has remained stable during the last few years.
Chain
An important note is that Renold competes in the industrial chain segment. they do not produce automotive or motorcycle chains. So, they are not exposed to the electrification of the automotive market. This also reduces the cyclicity of the business. Renold only manufactures industrial chains.
The range of references sold by Renold is immense. There are some more resistant to abrasion or corrosion, others that are lubrication-free and there are different levels of performance. There is always a product designed for each condition (indoor/outdoor, high/low temperature, etc).
The cost of a chain is relatively small but is critical to the well-functioning of the system of which is part. This means the customer can not postpone buying the chain if this does not work properly anymore. If they do not do so, they can face downtime and production. This is also why it is important to establish a global footprint, fastest delivery may save the client company a huge amount of money as production may be initiated faster.
Renold is placed in a premium position within the sector and its chain may cost between ten and twenty times the price of the cheapest option. Although this price disparity may look exaggerated, what should really matter to the customer is the total cost of ownership for a given period of time and the performance during this period.
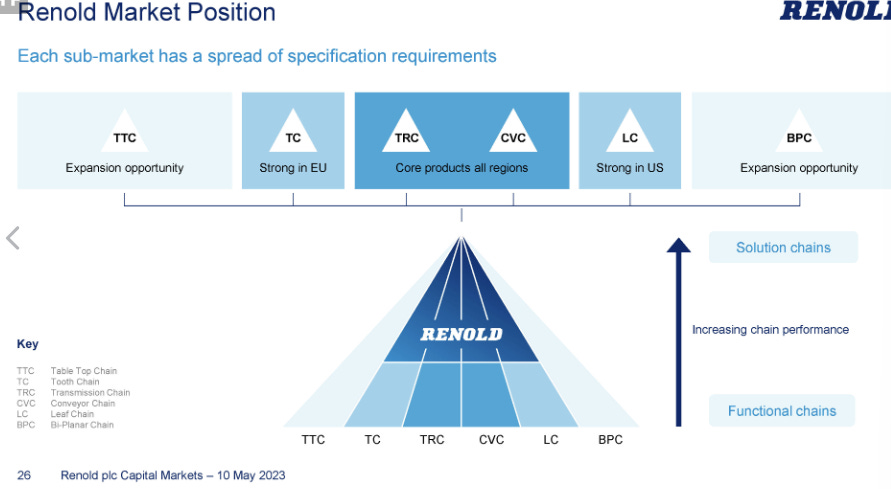
Renold is positioned in the dark blue area in the graph above, with more selling intensity in the Conveyor and Transmission chain. We think it may be less resilient during a crisis as customers may decide to go for the lower option as they are trying to reduce costs. However, around 75% of the sales are from replacement and it is a quite sticky product once the end user is used to one specific chain, it usually keeps using it for long periods.
It is the division where the company sees more value for the years to come and where most of the efforts are placed. We will also focus on this division.
Torque Transmission
The Torque Transmission division manufactures industrial coupling and gearbox solutions.
Although the weight of the total revenues and operating profits is way lower than the Chain division, the Torque Transmission is also performing well. In January, the division was awarded a £8.7 million contract to supply flexible couplings for the Royal Australian Navy’s Hunter class frigates. This military contract will extend until 2030.
The highest tailwind for the company is the automation in all the fields and sectors. As manual-intensive work is replaced by industrial machines with the need to move, pull, lift, or power, the demand for chains and torque transmission will keep growing. This is also a tailwind for the company’s costs as the revenue per employee has significantly increased.
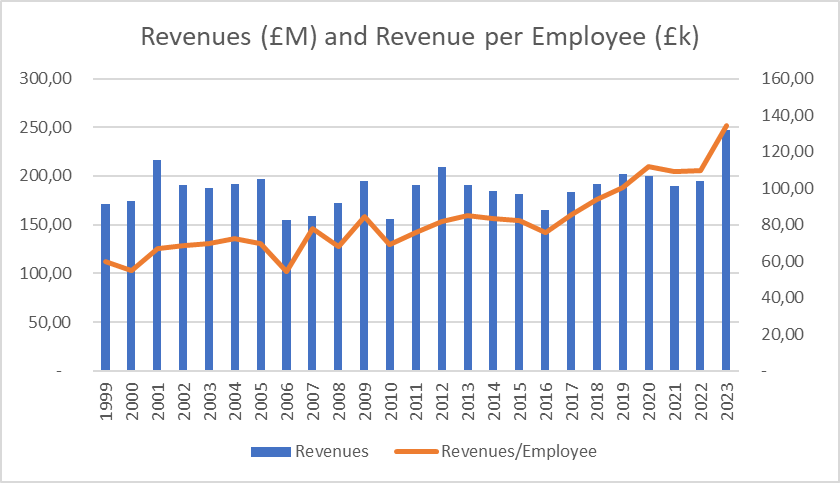
*Note: We use employees at year-end because for many years average was not available.**Note: In 2006, they sold the Machine Tools and Automotive business which in 2005 supposed almost 30% of sales (£70 million).
By type of customers, most of the sales are done to Distributors (45% of total sales) and Original Equipment Manufacturers (41%), with the remaining being sold to End users (14%). The most notable change during the last years has been a slight lowering in the percentage of end users and a rise in OEMs’. We believe that the OEMs and distributors have bought many stocks during these years when supply chain problems were so common. This may cause a short-term headwind as the destocking begins.
The Chain Market
The total addressable market size is estimated at +3 billion pounds and is expected to grow at similar rates to the general economy (3-4% depending on the report consulted) mainly driven by the automation industry which is expected to grow at double-digits until 2030. Of course here is taken into account the whole sector and within all types of industrial chains, and Renold is far from competing in all of it.
Industrial chains are absolutely everywhere: In escalators, in coffee machines, processing the grain, etc. There is not only one type of chain, there are thousands each for one specific item. As we remove the manual handling, we need more chains to help with the automation. This means there are millions of potential customers in every industry, what explains the importance of the OEMs and distributors, thus the commercial effort to reach all the end users would be simply non-efficient.
If we look at the supply side, there are hundreds of small, private competitors. They are both small in the geography and type of chain they target. Few are able to offer a wide range of product specifications as Renold does. In fact, with around 5-7% of the market share, Renold is the second largest competitor and the top 1 (Tslibaki) has also less than 10% of the market share. The top 10 competitors have less than 50% of the share.