Solaria - European leader in Renewable energy, trading at 5 years lows
Full analysis of a very interesting opportunity
Hi there!
This week
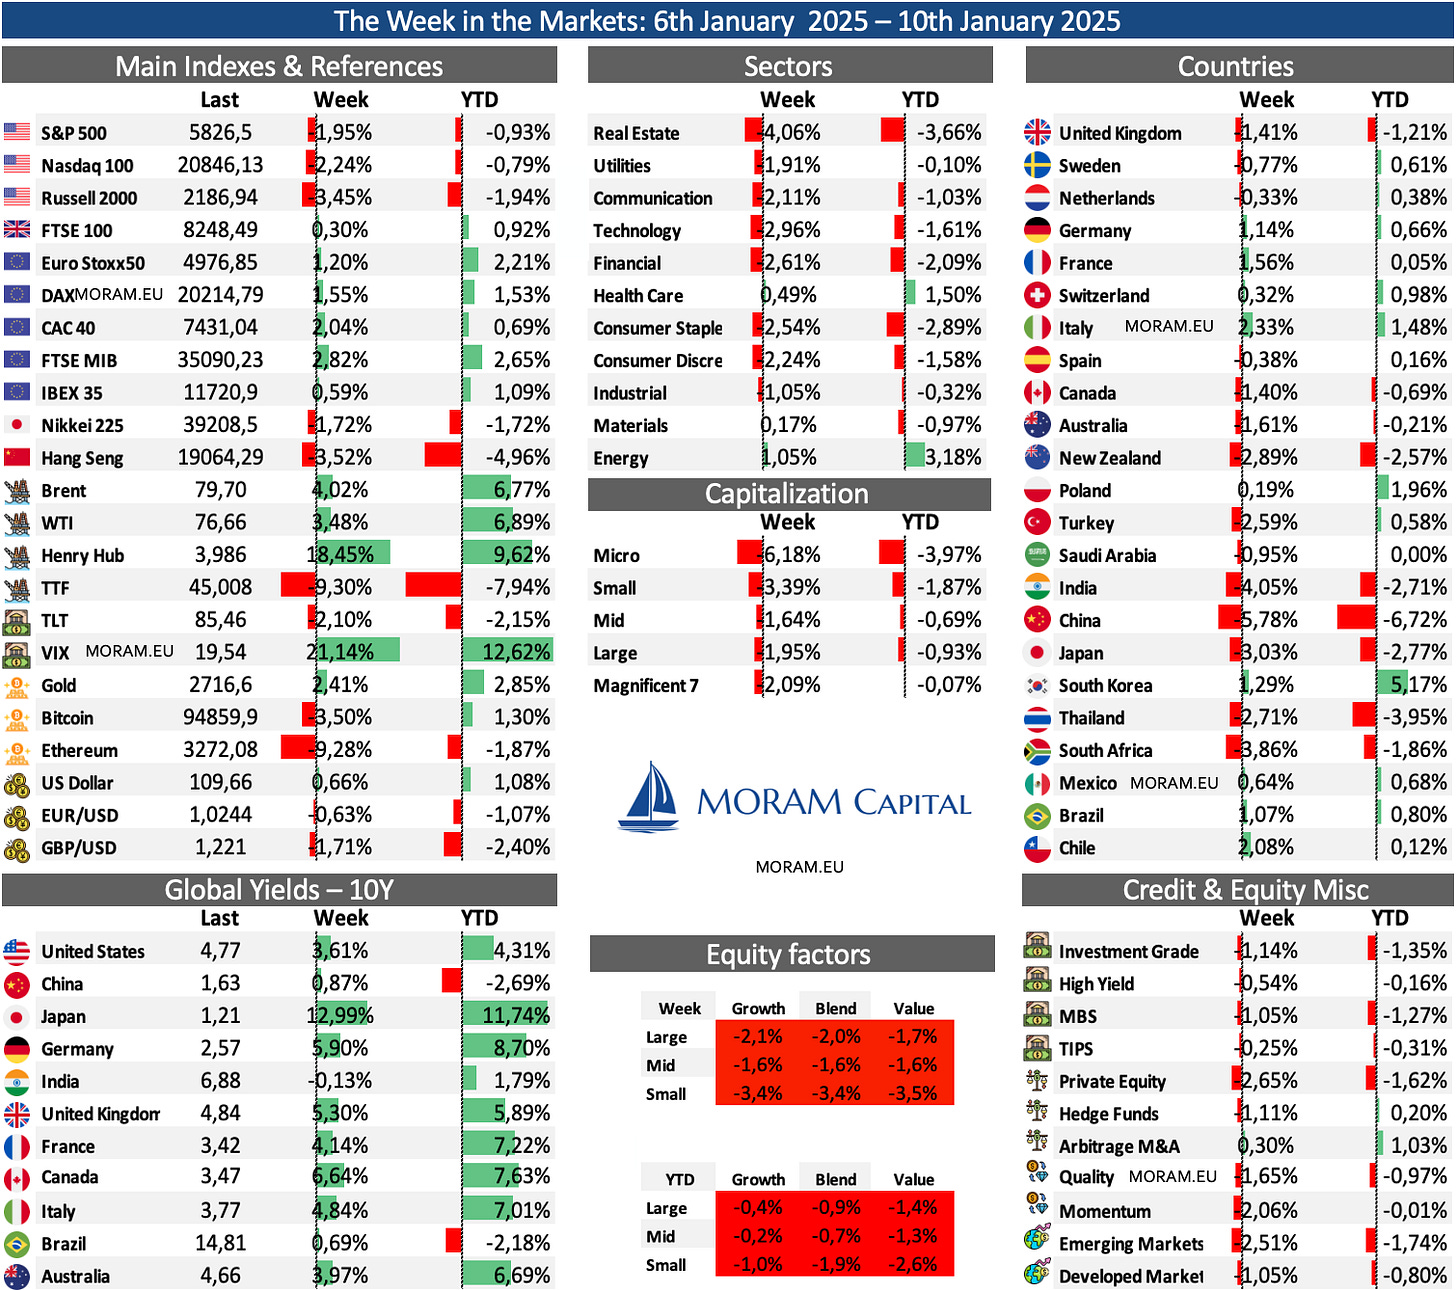
The Week in the Markets: One pager with a concise summary of the markets plus the highlights of the week regarding macroeconomy, liquidity, commodities, Bitcoin, Earnings season…
Solaria - Analysis of the leading company in renewable energy in Southern Europe, which is currently at 5-year lows due to delays in project commissioning (expected in 2025), after having multiplied their installed renewable energy capacity by 20 since 2018. We analyze in detail their energy generation business model and their recently launched Infrastructure and Data Centers divisions. We also provide a spreadsheet with detailed information on all their assets, debt, pipeline, electricity market, and valuation.
Portfolio Management 2025: This week, we sent our subscribers a detailed post about our portfolio at the start of 2025. It includes an in-depth discussion of the situation of each company, risk management strategies, and key trends to watch in the coming months.
Data Center
Nota: Toda esta publicación está disponible en Español en nuestra web
The Week in the Markets
Bad week for major indices, all of which closed lower. Despite a gradual decline throughout the week, the main driver was Friday’s employment report, which surprised to the upside (strong economy). This has led to expectations of further delays in rate cuts, with the first cut now expected in July.
As a result, small caps were the week’s worst performers, notably underperforming their large-cap peers for the fifth time in the past six weeks. That said, it hasn’t been a good start to the year for the "Magnificent 7" either, as this week’s declines (NVIDIA -5.93% and Tesla -3.83%) have already pushed them into negative territory for 2025.
At the sector level, the only bright spots so far this year are Healthcare (mainly medical instruments and healthcare plans stocks) and Energy. Commodities were the big winners on Friday after strong labor market data reinforced the notion that the economy still has momentum (also supported by other macro indicators during the week, such as ISM). Additionally, several indicators this week suggest that inflation will remain elevated longer than the FED initially expected, bolstering the view that there may only be one rate cut this year (as per the market's current forecast).
The VIX was the best performer of the week, reflecting the continued high volatility that characterized 2024. Alongside the fear of further declines, there was significant noise around tariffs this week—initially rumors of softer measures (indexes up Monday), followed by denials of those claims (indexes down).
Other big winners this week were Treasury yields, which rose sharply, largely due to Friday’s employment data, though they had already been climbing since Tuesday on ISM data and the FED minutes. Similarly, both the dollar and gold posted notable gains (in relative terms compared to their usual movements).
On the flip side, the euro struggled (along as the majority of currencies vs dollar). Given Europe’s macro situation, it seems highly likely that, despite this week’s uptick in inflation data, the ECB will cut rates at its January 30 meeting.
It was also a bad week for Bitcoin, the broader crypto market, and emerging markets. Most emerging market currencies—except the Russian ruble, supported by commodities—have been falling sharply against the dollar this start of the year.
(We are working on a dedicated one-pager to share weekly information on 27 currencies and their respective indices, which we hope to roll out next week.)
Highlights of the week
US Employment Data
The U.S. added 256k jobs in December 2024, the highest in nine months and well above expectations of 164k.
Healthcare +46,000, Government +33,000, Social assistance +23,000, Retail +43,000, Manufacturing -13,000
For 2024 overall, payrolls grew by 2.2 million jobs, averaging 186,000 monthly, down from 3 million (251,000/month) in 2023, reflecting a strong yet cooling labor market.
Wage growth remained moderate, with average hourly earnings rising 0.3% in December and 3.9% YoY, slightly below expectations.
The unemployment rate fell to 4.1% (vs. 4.2% forecast) due to a surprising 478,000 job increase in the household survey.
The direct effect of this (in addition to what was mentioned in the initial summary) is the reduced expectations for rate cuts. If the economy is firing on all cylinders (as these numbers suggest) and inflation is ticking up slightly, the FED has more than enough justification to hold off on cutting rates.
US ISM Services (Prices Paid)
The data published this week shows that prices paid by purchasing managers have reached a 22-month high. This increase in prices suggests inflationary pressures are building. And it is quite likely that we will be surprised with higher-than-expected CPIs.
This is another argument to think (as the market is doing) that the FED will not make further rate cuts in the short term. In fact, when this data was published, the S&P dropped more than 100 points.
Europe CPI
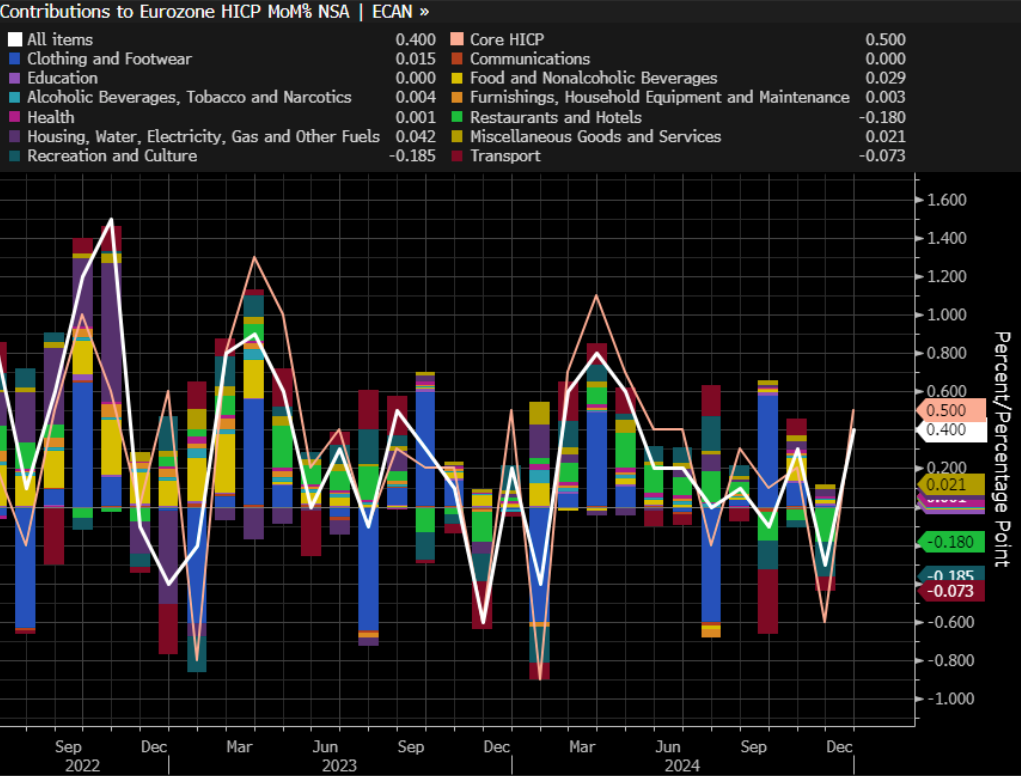
Annual inflation in the Eurozone reached 2.4% in December 2024, matching expectations and driven by base effects.
Energy prices rose slightly (0.1%) for the first time since July, while inflation in services accelerated (4%).
In contrast, inflation remained stable for food, alcohol, and tobacco (2.7%) and declined for non-energy industrial goods (0.5%).
Core inflation held steady at 2.7%.
Source: Bloomberg
Germany CPI
Among major economies, inflation increased in Germany, France, and Spain but decreased in Italy.
In Germany, CPI inflation just jumped from 2.2% to 2.8% in December. It rises 0.4% MoM, compared to the expected 0.3% (previous -0.2%)
Source: Bloomberg
United Kingdom
The 10-year gilt yield hit 4.8%, its highest level since August 2008, driven by rising global yields and mounting concerns over UK debt levels and the Labour government’s ability to implement its budget plans.
The pound is at a 15-month low.
Some interesting Data about markets this week
Coming Earnings Season (January 2025)
So far this year, it is very clear who the main beneficiaries are of interest rates not decreasing (because the economy is performing well) versus the main ones harmed by the fact that rate cuts are now only expected in 2025.
Another non-determinative but still significant piece of data about the current market situation is that the sales-to-purchases ratio shows that insiders are selling stock at the highest level in two years.
Solaria - Analysis of an sleeping giant
Introduction
Solaria is one of the leading renewable energy companies in Europe. Historically focused on photovoltaic energy in Spain, but also present in Portugal, Greece, and Italy, it has recently started diversifying into wind projects (UK) and initiated storage projects. Similarly, it has launched an infrastructure division to own the land where renewable projects are developed and has focused on the opportunity in Data Centers, where it expects to capitalize on the high demand from technology companies.
This is not the first time we’ve analyzed Solaria – in fact, the renewable sector is one we have been quite active in over the past few years. Primarily with Ecoener, but also in 2020 and 2021 with Greenergy, or the takeovers of Greenvolt and Greenalia. The situation is radically different now compared to late 2021, due to the rise in interest rates, the new regulation introduced in Spain in 2023, and investor sentiment towards the industry (it was one of the downsides of the Trump trade). This, along with a few issues we’ll explore in more detail, has left Solaria’s stock at a 5-year low.
Solaria was created in 2002 by its current CEO, it went public in 2007, but it was not until 2019 that it began its growth phase. In just over 5 years, combining ambitious goals and the best execution in the sector, it has multiplied its installed capacity by 20 times, going from 75MW at the end of 2018 to the current 1658MW (without the need of any capital increases). And it is this excellent execution capability – along with lower Capex per MW compared to its peers – that has allowed it to trade at a premium relative to the rest of the sector in recent years.
However, as shown in the image #2, it has gone five consecutive quarters without bringing new capacity online due to issues with contractors and small companies involved (details to follow). This is not expected to change until, at the earliest, 2Q25, which has understandably weighed on its market capitalisation which has gone from over €3Bn to €1Bn in just over 24 months.
Today, we analyze Solaria in detail to quantify the size of the opportunity the market is offering and the risks and key topics to consider for anyone interested in the company and the renewable energy sector.
We have mapped all its assets (MW, equivalent hours, MWh generated, etc.), its signed PPAs (and their prices), and government auctions (obtained at fixed prices for 10-15 years). We also analyze electricity prices, forward PPAs, and the expected situation in the coming months.
We analyze and explain in detail the new Data Centers and Infrastructure divisions.
Similarly, we have analyzed its debt (88% fixed/swapped), dividing it into project finance (with an educational explanation of how it works) and bonds, providing individual details of each and explaining the importance of the agreements with Santander and the European Investment Bank.
We review its economics and Solaria's valuation using two different methods.
To support all this, we have enabled a downloadable Spreadsheet file.


