
Valaris - Full analysis
Investing Is All About Asymmetric Bets
Hi there, we hope you had a fantastic week !
Please find this brief summary of the topics we are covering today
The Week in the Markets
Our weekly summary with the best charts to understand what happened in the markets in 1 minute, along with explanations for those who want to dive deeper.
Equities, Bonds, Currencies, Alternative Assets, Macro Data, company commentaries, Earnings Season, and much more!
Equity Research
Seadrill - Offshore driller with a fleet primarily composed of drillships, a healthy balance sheet, and a very compelling opportunity ahead of a potential new investment cycle by oil & gas companies in offshore exploration.
We analyze the state of the industry, explain the company, assess the risks, provide a valuation, and share our view on the opportunity.Valaris - Analysis of the largest offshore driller (by fleet - 13 drillships, 2 semisubmersibles, and 33 jackups) from an industry that, as we’ve discussed over the past few months, shows a clear risk-reward imbalance among several of its main players. We analyse and value their assets, the state of the industry, and our positioning with brutal honesty.
Restaurant & Beverage industry earnings preview (MTY Foods & TFF)
Portfolio Management
Including updates on our 3-stage monitor, comments on several companies, and our macro views, along with their respective movements in both equities and all asset portfolios.
Comments about NewPrincess, New Fortress Energy, Excelerate, Catana…
Investor Resources
Data Center Update
Financial model Updates
Nota: Toda esta publicación está disponible en Español en nuestra web
Disclaimer: This publication is for educational purposes only and should not be taken or considered as investment advice under any circumstances. Please consult with your financial advisor before making any investment decisions.
The Week in the Markets

Summary
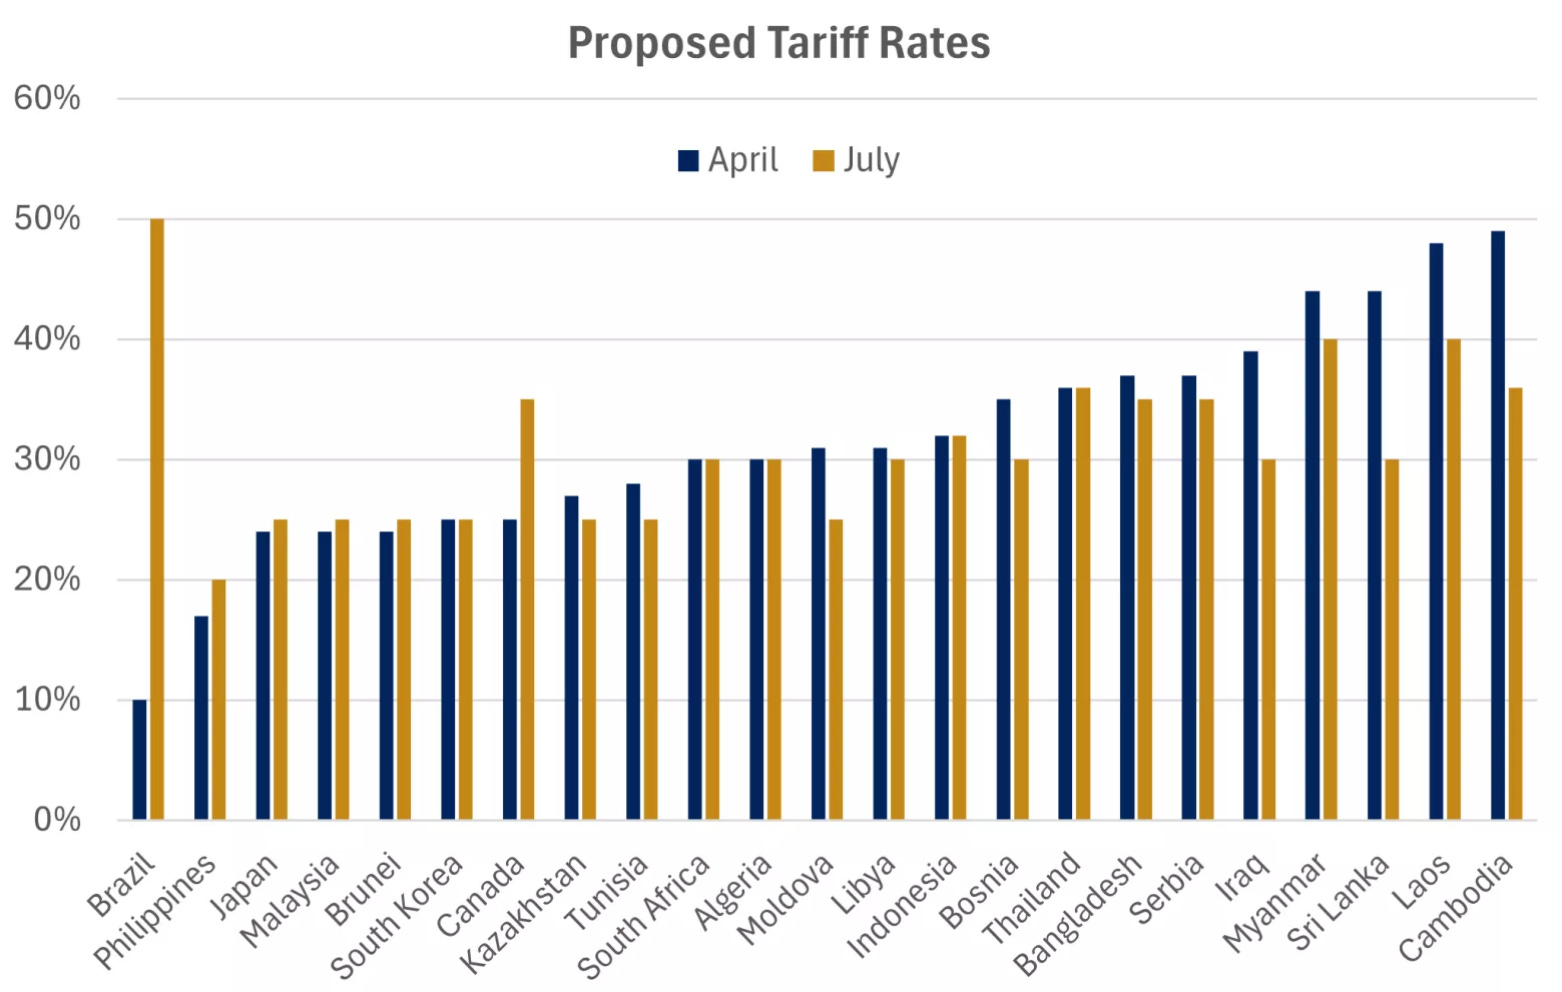
A quiet week with very low volume and barely any macro data. The main buzz came from the new news on tariffs — and while it's true that they caused the main indices to close lower, the general feeling is that the market paid much less attention to them compared to previous occasions (with the 90-day pause now extended until August 1st).
The US administration announced 25% trade levies on major trading partners South Korea and Japan, as well as tariffs at varying levels on other countries, including Canada, South Africa, and Thailand. In addition to the country-specific tariffs, President Trump also announced an upcoming 50% tariff on copper, which triggered a spike in copper futures.
Among the main indices, the S&P 500 and the Nasdaq (in which the Magnificent 7 have a combined influence of over 30%) performed better than small caps — in part thanks to NVIDIA's 3.5% gain this week, which propelled it to the historic milestone of becoming the first company ever to reach $4 trillion in market capitalization.
Europe — after many weeks of lagging despite a strong start to the year — once again stood out versus the US with significant gains of nearly 2%, and commodities rebounded sharply after recent weeks of losses. Similarly, the US Dollar rebounded this week and is up almost 1%.
However, in our view, the most notable development of the week was seeing Bitcoin reach new all-time highs, hitting nearly $120,000 and leading the way for the rest of the crypto space.
We’ve been sharing our thoughts on BTC with you over the past few years, and by now it probably shouldn’t surprise anyone that — in an era of such extreme fiscal irresponsibility as we’re witnessing (and we don’t say this just because of the US’s "Beautiful Bill" or the EU’s new spending plans, though they are certainly catalysts, but rather because of the past 15 years of constant monetary stimulus and its effects on uncontrolled debt growth and liquidity) — Bitcoin is gradually emerging as an alternative for citizens, companies, and institutions to preserve their purchasing power. We don’t know what will happen in the coming weeks, months, or years, but if this spending dynamic in the world’s major economies continues, it would be normal to see Bitcoin much higher than it is today — just like gold, which already has an established role in global markets — a statement that very few would challenge today
Another notable market trend that we find relevant is the rise in 30-year bond yields across the world’s major economies — with even Japan back above 3% this week. Silver is also hitting highs… different legs of the debasement trade that we’ve been talking about for quite some time now.
Interesting Data about markets this week & YTD
With the indices at all-time highs, it’s interesting to see how the main market players are positioning themselves — specifically in US equities. Among them, we’re seeing significant differences: institutional investors and hedge funds (Wall Street money) are selling, while retail clients are the ones buying, a trend that has been in place since early April (as shown in charts we've shared in previous weeks).

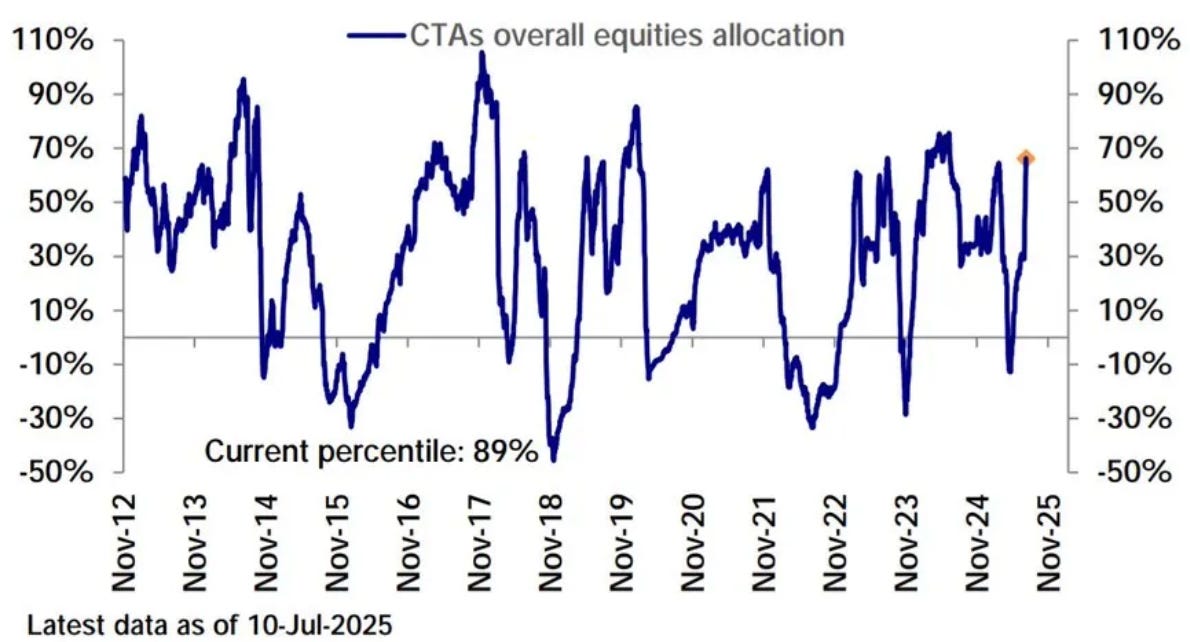
On the other hand, the rally is also being driven by CTAs, who have been aggressively buying since May. And although their positioning is near peak levels, it still appears they have room to increase exposure. That said, the current technical resistance around the S&P 500 remains significant.
Meanwhile, we wanted to share this chart from a highly relevant player in the markets. Over the past several months, China has been steadily reducing its exposure to US Treasuries — cutting it in half from 44% to 22% — while increasing its gold holdings, which have risen from 1.0% to 6.5% of total reserves since 2015.

In parallel, we also want to share this chart from Fidelity, which shows the correlation between the increase in M2 money supply and the rise in Bitcoin's price (logarithmic scale). While we don’t have a crystal ball to predict what will happen, but we believe there’s a strong chance that fiscal excess will persist — and that Bitcoin will continue its upward path.

Earning Season 2Q25
This week marked the start of the Q2 2025 earnings season with Delta Airlines reporting results. However, it's in the upcoming week that the season begins to pick up volume, with the financial sector reporting on Tuesday, alongside other key names like ASML, Netflix, and 3M throughout the week.

MTY Foods also reported earnings this Friday — results we analyzed closely, as we view the company as a proxy for the U.S. restaurant sector and a useful gauge of beverage consumption trends.

Introduction
To wrap up the series of offshore drillers analyses we’ve been publishing over the past weeks — including the Guide to the Offshore Drilling industry I and II and the Seadrill analysis — today we release our report on Valaris, one of the industry’s leading companies. (Though “wrap up” is relative, as we are currently reviewing Noble Corp and plan to publish at least one briefing on it sometime this summer.)
Unlike Seadrill, which is a pure player focused solely on drillships, Valaris is more diversified with a fleet of 13 drillships, 2 semisubmersibles, and 33 jackups, making it the largest by size in the industry. It also holds a joint venture with Saudi Arabia (ARO Drilling), leasing out 7 jackups under multiyear contracts.
Like most companies in the sector, Valaris filed for bankruptcy due to the COVID crisis in 2020 but emerged a year later with a nearly clean balance sheet (only carrying a $1.1 billion bond maturing in 2030) and net debt around $630 million. It has taken advantage of the high daily rates from 2022 to 2024 to repurchase shares instead of taking on new debt to order rigs.
They have a modern drillship fleet, with several units on multiyear contracts at attractive rates, plus other units whose contracts expire in 2026, providing upside exposure to the expected price recovery in the coming years. On the jackup side, 13 rigs operate in harsh environments, most under good contracts, and the JV with Saudi Aramco offers some protection against the current weak jackup market.
Today we provide an independent analysis of Valaris, reviewing its fleet contracts and the situation of each driller segment, aiming to understand the potential upside if the anticipated CapEx cycle for O&G majors and IOCs materializes, but also considering the scenario where this cycle is delayed beyond current market consensus.
Individual analysis of the different assets in their fleet
The industry situation and outlook
Financials & capital allocation
Their valuation (using two different methods)
Our perspective on Valaris’s situation